Why do gypsies have crystal balls? - So they can see themselves coming!
It is tricky to prove mathematically that betting success is not connected with luck because ‘luck’ is impossible to quantify or express in a formulaic manner.
However, it is possible to show empirically that betting selections chosen entirely by mathematical/statistical computations lead to long-term betting success without depending upon any fraction of luck. At Soccerwidow, we regularly employ a mathematical/statistical approach in our own blog entries and also in our articles published both in English and German on Betfair’s blog sites.
Since starting to write for Betfair in December 2011 our match previews and betting recommendations in the German language Betfair blog have been based exclusively on our own statistical analyses and probability computations, which enable us to find and select bets with a mathematical advantage, or ‘edge’ over the odds on offer. This is otherwise known as VALUE betting.
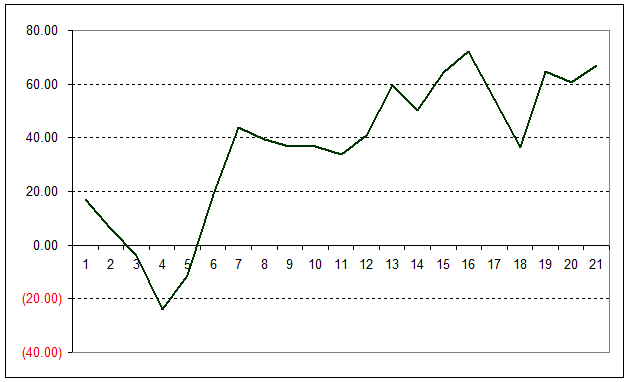
The simple line graph below shows the profit and loss trend we have experienced since December:

Although we have now compiled three months worth of results, the data sets are not yet large enough for full confidence in our strategy. To date, we have previewed 21 matches and selected 56 various bets. We would have liked to publish more, but at this moment around three hours is required for each analysis in order to compute probabilities and identify value bets (if indeed there are any), including writing the article itself and publishing it.
Our entire experiment is based on a fixed win/risk staking plan (equal win, equal risk). This staking plan takes probabilities into account, meaning that there is a higher stake (i.e. risk) for bets with a higher chance of winning, and a proportionately reduced stake the lower the chance of winning a bet becomes (i.e. providing for more attempts to get a ‘hit’ at higher odds).
In essence this means the stakes employed depend upon the odds, but the risk and attainable profit remain constant. Our wagers in this public experiment have therefore always been limited to a maximum risk per bet of 10 units, or to a maximum win of 10 units.
Fixed Win/Risk Strategy Examples:
- Back Bets at odds of up to 2.0: Example 1.69; the stake (risk) is 10 units; if the bet wins, the winnings are 6.90 units; if bet loses, then 10 units are lost.
- Lay Bets at odds of up to 2.0: Example 1.69; winnings are capped at 10 units; if bet wins, the winnings are 10 units; if bet loses, the loss is 6.90 units.
- Back Bets at odds over 2.0: Example 3.5; winnings are capped at 10 units; if bet wins, the winnings are 10 units; if bet loses, the loss is 4 units.
- Lay Bets at odds over 2.0: Example 3.5; loss is capped at 10 units; if bet wins, winnings are 4 units; if bet loses, then 10 units are lost.
At the end of February profits amount to 66.97 units after 56 bets. Beginning with a starting bank of 50 units as the initial investment back in December, the return is currently 134% of this investment. If the total of all stakes (risk) is taken as total investment then the ROI (Return on Investment) computes to 15.8%.
The above graph clearly shows that the profit/loss curve does not run smoothly and indeed there were times when the bank dropped. The explanation for this is straight forward. For example, a bet with a 60% probability of winning indeed wins on average only six times for every 10 bets placed. On average, four out of 10 bets with a 60% computed chance of winning actually lose. Not every bet is going to win.
Moreover, actual results have a habit of not lining-up with reliable conformity and unfortunately, it may happen that the four out of 10 bets predicted to lose happen one after the other despite each having a 60% calculated probability of winning.
Here is the full list of bets transacted so far sorted into probability groups (our calculations using the Soccerwidow Value Bet Detector Spreadsheet):

Interpretation of the table above:
Except in the 20%-40% cluster, in which all 8 bets lost (according to expectations, 2 or 3 bets (approximately 30%) should have won), all the other groups achieved, more or less, their expected hit-rates, despite the relatively small sample quantity.
The groups exceeding expectations were the clusters ‘up to 20%’, and ‘60%-70%’, whilst results in the groups ‘40%-60%’ and ‘80%-90%’ lie exactly within expectations. The groups ’70%-80%’ and ‘more than 90%’ performed slightly below statistical expectations.
As the sampled results pool grows larger, perhaps in a year’s time the analysis will comprise some 300 to 500 single bets and it can be expected that the winning/losing bets will settle down closer to the expected distributions within their cluster groups. This expectation is clearly not connected with luck!
Here’s our Excel .xls table for download with all the data used for this article, plus all the individual bet results. This may also provide you with some sort of standard for the extent of monitoring necessary to remain in control of any betting strategy.
- Go forward one month to March’s summary
The spreadsheet relies on inputting historical results for the game you are analysing in order to see how accurate the odds are being offered by the market. The formulas do the rest and display the value bets available for more than 100 betting options (including Asian Handicap HT and FT), leaving you to decide which ones to include in your portfolio.


