
Both inexperienced and first-time punters new to the world of online football (soccer) betting may be pondering the question, “What actually is 1X2 betting?“
 Image: archideaphoto (Shutterstock)
‘1X2’ is an abbreviation of the three possible outcomes in a football match: home win (1); draw (X); away win (2).
This market is also known as ‘HDA’ (Home-Draw-Away), or sometimes simply ‘FT’ (Full-Time match result).
The act of 1X2 betting is referred to as “betting on the full-time result”, “match betting”, or can be termed a “three-way bet”.
Definition of ‘Full-time’
Full-time is reached in a football match at the close of the second half of 45 minutes’ regulation time plus the time added-on by the officials for stoppages. When the added-time has elapsed, the referee’s whistle signals the end of the game.
All 1X2 (HDA) bets relating to the result of the match then begin to be settled by the bookmakers.
In a fixture requiring an outright winner, in the event of a draw or tied aggregate scoreline at the end of the regulation match time, two periods of extra-time may then be played to break a deadlock.
It is important to reiterate that full-time 1X2 bets are closed and settled on the result at the end of a regulation period of 90-minutes’ play (2x 45 minute halves, plus added time), and after this, new markets will then appear in most bookmaker platforms for extra periods of play (extra-time) or penalty shoot-outs.
Placing a Bet
It is possible to place a match-result bet either before the kick-off (ante-post bet), or whilst the game is in progress (in-play bet).
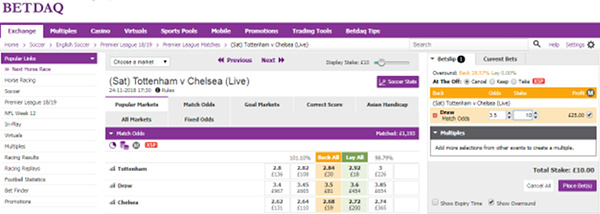
In the English Premier League (EPL) match shown below (screenshot courtesy of Betdaq betting exchange), we have elected to back the draw at odds of 3.5. (Decimal or ‘European’ odds).
In this case, the bet was requested by clicking on the yellow-highlighted square bearing the odds of 3.5 in the ‘Back All’ column.
(Click on the image below to enlarge it in a new tab):
Having clicked on the draw price, a bet slip opens up to the right of the screen, ready for insertion of our stake. Here, we have entered a figure of £10.
The profit due from our wager should the match indeed end in a draw is shown as £25.
In order to strike this bet, the next step would be to click the purple button ‘Place Bet(s)’.
What do Bookmaker and Betting Exchange Odds mean?
Just as a side note… When we write articles showing mathematical calculations we always prefer to use European odds, also known as decimal odds.
It would go too far to explain in this article the whole concept of betting odds but here’s an article on that topic if you are interested in learning more: Understanding Betting Odds – Moneyline, Fractional Odds, Decimal Odds, Hong Kong Odds, IN Odds, MA Odds
In short, betting odds show how much you will be paid out if your bet wins.
However, odds can also be converted into their ‘implied’ probabilities and here’s the formula:

Betdaq’s prices for our example match (at the time of the screenshot grab) were:
Draw: 3.50 = 1/3.50 = 28.57%
Away win: 2.68 = 1/2.68 = 37.31%
Theoretically, because there are only three outcomes to a match (home, draw or away), the probability percentages of each should add up to 100%.
But, in reality, the percentages on any one match with any single bookmaker will always be above 100%; using our example odds, it’s 101.09% (35.21% + 28.57% + 37.31%).
Why should this be?
Bookmaker vs. Betting Exchange Overrounds
The percentage difference over and above the 100% base probability figure is known as the bookmaker ‘overround’, ‘margin’, or ‘vigorish’ (or ‘vig’). This represents the bookmaker’s expected profit.
In its simplest form, for every 101.09 units the bookmaker accepts as wagers on the odds of our example match, if the wagers remain stacked in the same proportions as the implied probability percentages, then the bookmaker will pay out only 100 units, thus ensuring a profit regardless of the match result.
However, our example here is a betting exchange. Like all other exchanges, it guarantees a profit from every match by charging commission on all winning bets. Here, Betdaq’s commission rate is 2%.
The overround calculations now become slightly different because the commission amount has to be factored in.

Draw (3.50): 1 / (3.50 – [(3.50-1)*0.02]) = 28.99%
Away win (2.68): 1 / (2.68 – [(2.68-1)*0.02]) = 37.79%
You can see that at the same odds, the implied probabilities now add up to 102.45%. Because of the commission element, exchanges tend to have a larger overround than bookmakers, even if it seems at first glance that exchanges have better prices. In fact, rewards are generally higher with a bookmaker.
Here’s the formula to convert odds in an exchange into their ‘real’ odds (after commission) in order to compare directly with bookmaker odds:
So, in our example match, the ‘corrected odds’ were as follows:
Draw (3.50): 3.50 – [(3.50-1)*0.02] = 3.45
Away win (2.68): 2.68 – [(2.68-1)*0.02] = 2.65
What do the Implied Probabilities mean?
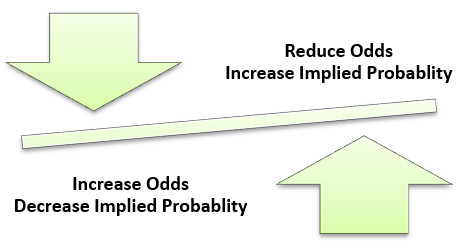
The important thing to remember is that converting odds into their implied probabilities is not an accurate indicator of the percentage chances of each outcome. Bookmakers adjust their odds (prices) due to demand, which leads to distorted ‘implied’ probabilities. These are normally very small and not easy to spot but enough for the bookmakers to stay in business and make consistent profits.
Implied probabilities reflect much more the public perception of the likely outcome (not the statistical likelihood), being a measure of the volume of money wagered on each outcome rather than its real chances of success.
And odds fluctuate throughout the ante-post and in-play markets according to the weight of money placed and other factors such as time elapsed in the match.
It is, therefore, not advisable to rely on the market odds (at any moment in time) as a totally accurate benchmark of the event probabilities.
In order to more accurately gauge ‘true’ probabilities, it is advisable to take a purely mathematical approach using historical results and statistics.




Greetings, I do not agree with part of the explanation about the real probabilities in relation to the bookmaker’s odds. The only interesting detail is that before the start of a football match, the betting houses have to calculate the initial odds, that is, the first odds that they will set for the first bettors, since the initial odds must reflect the most likely odds. close to the real event and thus not lose money in the long term, since the probabilistic calculations have to be very close to the long-term future results and the second reason is that the betting house, when setting the first initial odds for the first bettors , they must reflect the real event as closely as possible, in order to pay the first bettors as fairly as possible. But on the other hand, when more bettors are added and money begins to accumulate in the three pots (1X2), then they do begin to update the odds based on the results (in the bettors’ bets), not on estimates, as They did it at the beginning with the initial installments
Very good and detailed explanation. Thanks for sharing! This will help me a lot for new betting strategies 😉
All the best!
Peter
Wisdom of the crowd is something I have read about. The theory being that people bring many different opinions, knowledge and information to the market, and the outcome is that the odds we see at closing reflect all of that; to the extent that after removing the bookmaker margin you have a a very close reflection of the true probability of any result occurring i.e 1×2.
Joseph Buchdahl, the guy who runs the Football-data website run a test on thousands of game his site holds data for. I think it was one or both of Betffair and Pinnacle closing odds data, and with the margin removed, the actual returns on betting every outcome blindly to level stakes was 99.7% correlated i.e actual returns was almost equal to expected returns.
That level of correlation is therefore reflective of a very efficient market.
I hadn’t really looked too much into that hypothesis before. But the proof he offered is pretty compelling. So if you look at Pinnacle’s market as one that is very efficient, and if you believe that to be the case, then beating their closing odds is the only way to obtain true value. And if you can constantly beat their closing odds, then you would need to be very good at predicting line movement, or come up with a way to forecast future results such that in effect you have better knowledge than the market. Or of course, place bets with bookmakers that have better odds than Pinnacle. But I guess those books would ban you for exploiting loss leader types of odds constantly.
That’s where the concept makes you think “Well, how do I generate information, or a model that predicts probability outcome better than the efficient market?” Of course, here we can get access to the value calculator, cluster tables, HDAFU tables.
I know people who run a poisson distribution method with varying success. Speaking of poisson, I made a simple calculator for that in excel, which took about 1 hour, and it does a pretty good job of coming up with odds that are very close to the bookmaker odds. Whether I believe that my model is a better estimator of the true odds than the bookmaker and the information in the market is another story.
And the other thing that occurs to me is that if the odds movement is a constant tug of war between backer and layer, buyer and seller, then if the value is there, it won’t be there for long as buyers will snap it up and the odds will correct.
I do think being successful at sports betting is a long and difficult road.
Good luck with your own endeavors Peter.
Hey Simon
thanks for your reply.
Yes, that was what I was refering to. Under the efficient market hypothesis it seems kind of impossible to me to predict the outcome of an event more precise than the market does since the market is efficient. So i am having troubles with the argument made here : “In order to more accurately gauge ‘true’ probabilities, it is advisable to take a purely mathematical approach using historical results and statistics”.
Historical results are somewhat flawed for predicting outcomes in sports, I think. Since the teams are not the same for each season. The coach might be changed or the style a team plays. There are just so many omitted variables we dont consider if we just check historical data and compute averages or quotients. Thats why I am actually so interested to see your real results, you who have bought tables etc.. It would really suprise me if you could make profits from this in the long term over a decent sample size of bets
In my opinion, there are 2 ways to beat the market consistently and none of them is in my understaning relying soley on historical data.
1. You know the sports your betting really well and can estimate the odds better, at a given time, which makes you beating the closing line. But, again this knowledge is not just based on past outcomes. Rather on how the team performed – like a team can lose but play really good soccer while the other got just lucky or so.
2. Is ingame. There is very prominent example on twitter. I guess he is just really good in reading a game which is inplay.
But when I read that the expected yield for some rather major leagues are above 10%, it is really hard for me to even be able to imagine this. How shall this work by just analyzing numbers which everybody can acess for free. If you could make even 1% ROI across major leagues that would be absolutely nuts. And if there is something like this, why should it still be there and not be absorbed by the market?
Value calculator etc. are soley relying on historical data. I would argue when the odds in the market differ from your calculator or poisson distribution than they do so, because of a good reason. Like injured keyplayer, wheather or whatever.
Btw, it would be pretty interesting if your “true” estimated odds beat the pinnacle closing line and by how much. Could you check this? If tables etc. are working we might expect they beat the pinnacle closing line more than 50% of the time.
Peter,
I’m happy to share my own personal results for the 3 campaigns I have run. Winter 2017-18 ended successful. Summer 2018 was not a success. Winter 2018-19 I am having a rough time with that at the moment.
The volume of data in the worksheet I keep, I can’t really copy that coherently to the blog because of formatting issues. I can send you my worksheet if you would like.
One thing in relation to beating pinnacle odds when using hdafu tables is this. For a selected system it will be an odds range or quotient. Let’s stick with odds range for now and say the odds range is 2.5 to 4 for home wins. The zero odds for such a system assuming its profitable would typically be lower than the 2.5. Let’s say it’s 2.2. On that basis every bet in the system is a value bet. Last year the bet placement process was to place bets at kick off, so if pinnacle was the highest odds at that time, you would bet with pinnacle if you can access their book. So for that bet you wouldn’t beat their closing odds.
If someone is good at predicting odds movement they could anticipate that the odds will be reduce closer to kick off and so bet earlier and thus beat the closing odds. But fundamentally the hdafu tables don’t require you to beat pinnacle closing odds.
Personally I just record the odds I get and not the bookmaker. The reason being I don’t use loads of bookmakers; just 2 main ones and an exchange. I do have access to pinnacle so the odds I get are nearly always in the upper echelons of what is available.
Last year over 24 systems that I used, spanning 1st and 2nd half of season, 58 stakes of profit were made. Now, that could have been a lucky season, it may have been as a result of hdafu tables working as intended. I don’t have the mathematical capability to analyse my results and determine if it was luck or skill.
Suffice to say I’m intrigued by the various arguments from different people on ways to beat the market.
Hi Soccerwidow,
I am wondering how anyone could get an advantage over the market by using mathematically or statistically approaches which rely soley on past results. Wouldnt this imply that soccer outcomes follow a certain kind of distribution?
Additionally, there is statistically proof that the closing odds without overround are in almost perfect linear relation to outcomes. There are also some papers out there where people succesfully beat the market by using this relationship. I guess you are familiar with wisdom of crowds.
Hi Peter,
here’s an image that shows you the relation of outcomes (observed results) to bookmaker odds:
They are pretty close, but certainly not “in almost perfect linear relation”. Bookmakers have to make money to thrive their businesses.
Please take a closer look: The first 300 matches (up to probabilities of ca. 70%; odds below 1.43) the trendline of the observed results is below the bookmaker odds. That means that the bookmakers calculate their prices (odds) for the bets on probabilities that imply slightly better probabilities that they should be.
So, for example, if a bet has a true calculated likelihood (based on past statistics) of 75% of winning (odds should be 1.33), the bookmaker will probably offer that bet at odds of 1.28 (implied probability 78%). This is pretty close and may seem “in almost perfect linear relation to the outcome” but it’s not a 100% overlapping. The bookmakers factor in that matches with clear favourites may lead to a loss if the favourite wins and that many punters prefer backing a favourite to the other 2 possible outcomes.
Odds setting has a lot to do with the “wisdom of the crowd” but only if you look at it from the marketing and profit optimisation aspect of bookmakers. They certainly take the psychology of the crowd into consideration when adjusting their odds. If there are leagues in which the majority of punters is likely to bet on the favourite and even include them in their combis, of course, bookmakers will take “the wisdom of the crowd” into consideration when setting their odds!