The best test of any theory is always how it works in practice:
Below is the full account of our FT 1X2 results campaign for the 2019 ‘Summer Leagues’ based around Soccerwidow’s HDAFU ~ Home – Draw – Away – Favourite – Underdog Tables.
The final profit curve for the 2019 Summer League Campaign (comprising all 419 bets) is shown below:
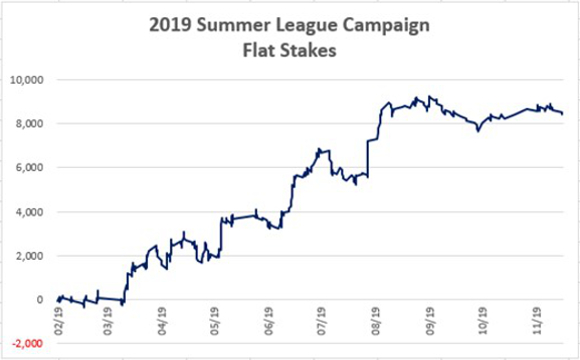 2019 Summer League Campaign Profit Curve
The systems employed in each league were all picked based on observations of the profit curves produced from the accumulated data (match odds and results) of the previous five complete seasons.
Read on to find out exactly how and why we picked the systems we did…
Campaign Report 2019 Summer Leagues
If you would like the accompaniment for this article please click on the button below to get your FREE 2019 Summer League Campaign spreadsheet, which pares down each system to individual match detail.
>>> 2019 summer league campaign <<<
(Then click on the green Checkout button, fill in your name/email address details and press Submit Order. A download link will then be sent to your email address – and it won’t cost you a penny! Check your junk mail if it doesn’t arrive in your inbox immediately).
How the Systems Were Chosen
Our long-held tried and tested method is to use the HO/AO quotient (i.e. the figure derived from dividing the home odds by the away odds) as the most reliable benchmark for categorising an individual match and allow comparisons or groupings with others.
Employing the quotients of all matches in a league over the previous five complete seasons provides a significant data set with which to carry out in-depth analyses.
Then, by producing graphs for each of the Home-Draw-Away-Favourite-Underdog results, it is easy to visualise betting results and trends.
Constructing a balanced portfolio of ‘systems’ in our chosen leagues is then just a matter of identifying and choosing historically lucrative segments of the profit curves upon which to target our bets in the forthcoming season.
For the purposes of diversification, we chose two systems for each league: one representing the 1st half of the season and the other for the 2nd half of the season.
In all of the leagues summarised below, you will see images taken directly from the 2019 HDAFU tables. (Containing the data from the five seasons prior: from 2014 to 2018)
When deciding upon which segment of the profit/loss curves to choose as our systems in each league, we compared the relevant 1st and 2nd half-season graphs (i.e. representing half of the data set in each case) with that representing the Whole Season (the whole of the data set).
If the segment of interest in, say, the 1st half-season graph was mirrored to some degree in the Whole Season analysis, then it was considered more likely to be influential on the whole-of-season picture. Ditto with the 2nd half-season.
In almost every case, you will see visual similarities between the chosen half-season system and the whole-of-season graph, whereas the graph belonging to the other half of the season is usually very different.
However, in a few examples, the chosen segment of the graph is mirrored in all three graphs (1st, 2nd and Whole-of-season), making it even more likely that the chosen system for the future had a significant influence on the historical picture across the previous five seasons.
Judgment of Risk
You will find a Risk Table (Image 8) and explanatory commentary in our dedicated risk judgment article.
League-by-League Breakdown
In alphabetical order…
League 01) Brazil: Série A
System 1 – 1st Half: Away Win
High-risk
Here, the visually similar peaks in the profit curves between the 1st half and whole-of-season graphs were indicative of a potentially lucrative system:
(Clicking on all of the images below enlarges them in a new tab):
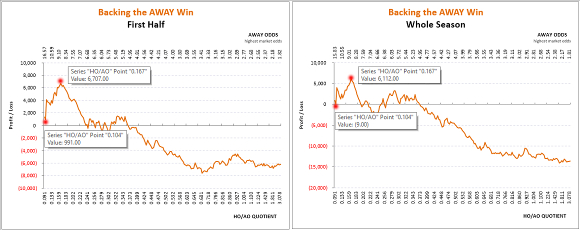
By comparison, the 2nd half-season graph looks very different:
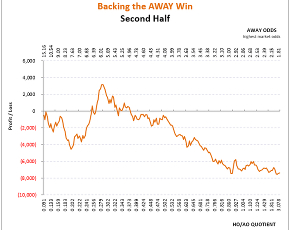
Between odds of 6.00 and 8.00 in the whole-of-season graph above is a less definite picture containing peaks and troughs of ‘statistical noise’.
To conclude, the 1st half-season system of choosing away wins between HO/AO quotients of 0.104 and 0.167 seems to be more influential on the overall picture in this league.
RESULT
In our campaign from 28/04 to 15/09/2019, there was a total of 17 bets satisfying the HO/AO criteria. 15 of these bets lost and only two won. The odds of the bets placed ranged from 8.45 to 12.39.
However, the two bets that won were sufficiently high priced to earn this system a profit.
Profit: £366.00
System 2 – 2nd Half: Home Win
High-risk
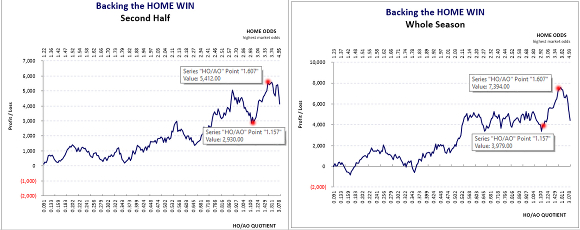
And again, the 1st half-season graph looks very different:
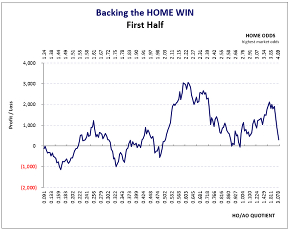
In the 1st half graph, this area does show an incline but it represents a gain of fewer than 1,000 units.
By comparison, the 2nd half-season system employed spanned a gain of 2,500 units in the previous five seasons. (Between 2,930 and 5,412 units)
The equivalent whole-of-season graph shows a gain of 3,400 units. (Between 3,979 and 7,394 units)
RESULT
In our campaign from 22/09 to 01/12/2019, there was a total of 13 bets satisfying the HO/AO criteria. Seven of these bets lost and six won. The odds of the bets placed ranged from 3.01 to 3.45.
Profit: £588.00
League 02) China: Super League
System 3 – 1st Half: Away Win
Low-risk
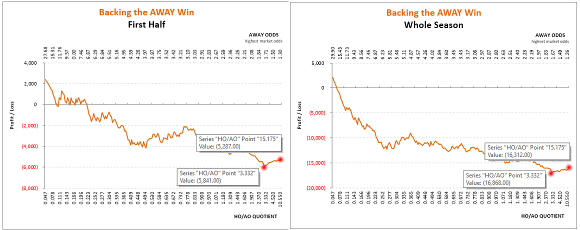
But, the away win selections highlighted in the chosen quotient of 3.332 to 15.175 were all odds-on favourites between around 1.20 and 1.80.
The 2nd half-season graph did not show anything as pronounced in this area.
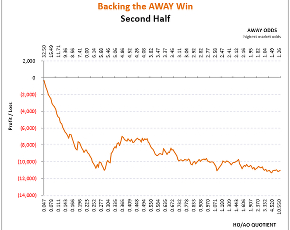
We knew from the outset that we wouldn’t be playing for massive gains with this 1st half system.
But, when there is little else to find in the analysis, choosing a low-risk system or a home-win or a favourite-based system are the prudent choices.
RESULT
In our campaign from 30/03 to 30/06/2019, there was a total of six bets satisfying the HO/AO criteria. Two of these bets lost and four won. The odds of the bets placed ranged from 1.37 to 1.60.
Profit: £21.00
System 4 – 2nd Half: Draw
High-risk
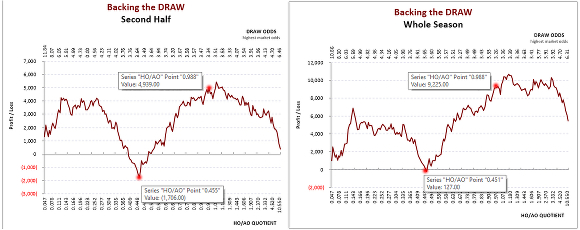
Looking at the 1st half-season graph it was evident that the draw in the second half of the Chinese season showed the stronger trendline.

The upper quotient wasn’t extended further: it could have been taken to the next and final peak of around 1.07.
However, it was decided that the final peak represented diminishing returns for a higher risk.
On the 2nd half-season graph you can see before the last peak after 0.988 was a trough of roughly equal size. Therefore, the chances of increasing the profit beyond the 0.988 parameters were roughly 50/50 (i.e. ‘heads’ and the bottom line increases; ‘tails’ and it reduces – this snakes-and-ladders game wasn’t worth playing).
RESULT
In our campaign from 06/07 to 27/11/2019, there was a total of 26 bets satisfying the HO/AO criteria. 18 of these bets lost and eight won. The odds of the bets placed ranged from 3.32 to 4.29.
Profit: £355.00
League 03) Finland: Veikkausliiga
System 5 – 1st Half: Draw
High-risk
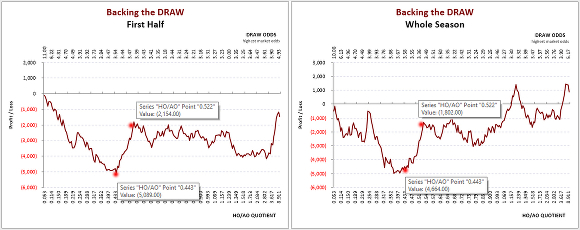
It may seem paradoxical that this part of the curve appears below the profit line in the graph (i.e. in the ‘red’) but as you can see the curve begins around -5,000 units and climbs to around -2,000 units, meaning the results in this sector are combining to create a profit of around +3,000 units (i.e. an improvement from -5,000 to -2,000).
The 2nd half-season graph was again very different.
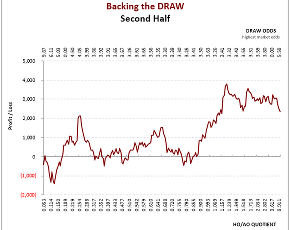
But, as you can see from the odds label at the top of these graphs, a system in this zone would involve backing draws at considerably longer odds (i.e. a far higher risk system), and with only 2,000 units profit made in the previous five seasons.
RESULT
In our campaign from 03/04 to 19/06/2019, there was a total of five bets satisfying the HO/AO criteria. Four of these bets lost and only one won. The odds of the bets placed ranged from 3.33 to 3.63.
Loss: -£137.00
System 6 – 2nd Half: Favourite
High-risk
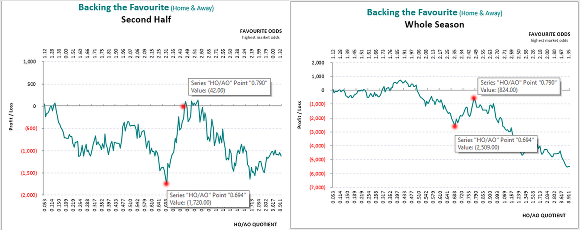
The 1st half-season graph showed once again what huge differences exist between the 1st and 2nd halves of league seasons as far as match results and odds are concerned.
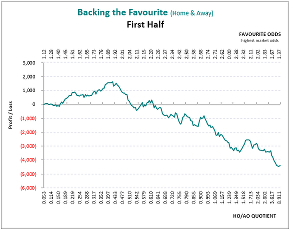
Dividing this by five to give a seasonal expectation meant that nothing spectacular could be expected from this system.
However, the favourites alluded to would all be home favourites between odds of 2.30 and 2.45 meaning that a profit would be secured even if there were an equal number of winning and losing bets.
RESULT
In our campaign from 27/07 to 19/10/2019, there was a total of four bets satisfying the HO/AO criteria. Two of these bets lost and two won. The odds of the bets placed ranged from 2.33 to 2.43.
Profit: £68.00
League 04) Iceland: Úrvalsdeild
System 7 – 1st Half: Home Win
Medium-risk
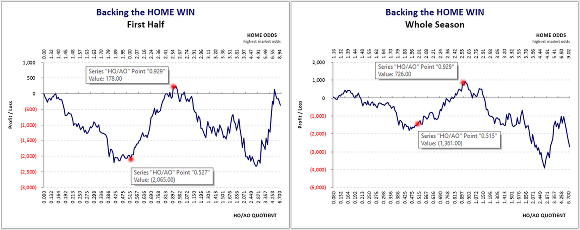
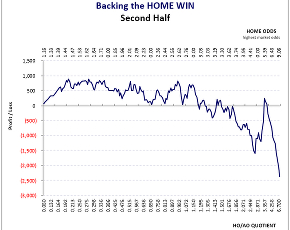
The home odds for these bets were likely to be between around 2.00 and 2.60.
Dividing the five-season profit figure of the proposed system produced an expectation of just 400 units profit per season.
RESULT
In our campaign from 27/04 to 06/07/2019, there was a total of 18 bets satisfying the HO/AO criteria. Seven of these bets lost and 11 won. The odds of the bets placed ranged from 2.09 to 2.56.
Profit: £668.00
System 8 – 2nd Half: Draw
High-risk
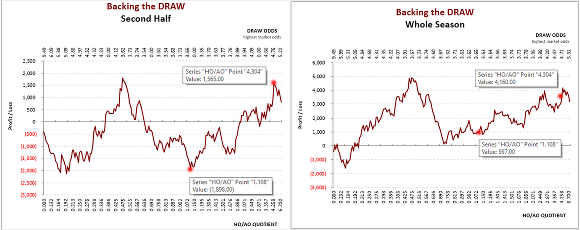
Once again, the 1st half-season graph bears little resemblance.

In all cases, the away team will be the favourite to win the match.
Expectations are higher than the 1st half-season home win system (here, around 700 units per season on average) but, with higher rewards on offer, the risks are also greater.
RESULT
In our campaign from 13/07 to 22/09/2019, there was a total of 20 bets satisfying the HO/AO criteria. 14 of these bets lost and six won. The odds of the bets placed ranged from 3.44 to 4.21.
Profit: £188.00
League 05) Ireland: Premier League
System 9 – 1st Half: Home Win
High-risk
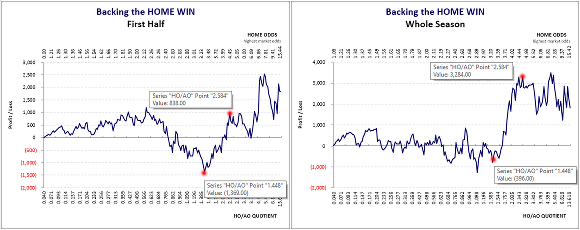
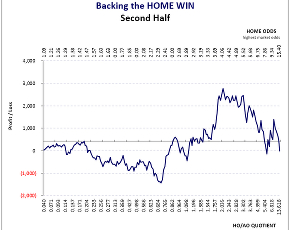
This places the home win bets in a zone of odds between around 3.40 and 5.00: In other words, every bet we make will be on a home underdog to win.
The rewards are not great (around 500 units per season on average), but there is little else to aim in the 1st half of the season in this league.
It may be high-risk, but the consolation is that it is also a home-win-based system.
RESULT
In our campaign from 22/02 to 18/05/2019, there was a total of 15 bets satisfying the HO/AO criteria. 11 of these bets lost and four won. The odds of the bets placed ranged from 3.42 to 4.81.
Profit: £158.00
System 10 – 2nd Half: Away Win
High-risk
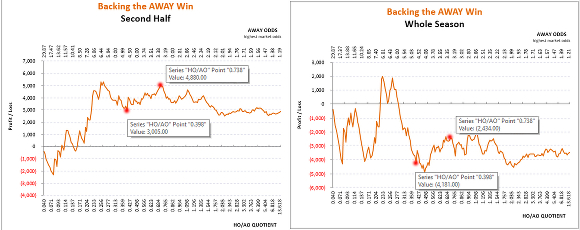
The 1st half-season picture contains a similar shallow rise towards the right-hand side of the profit curve but, like the other two graphs, this is in a zone where odds-on favourites are winning very small increments to the bottom line (amounts which are barely worth the work involved).
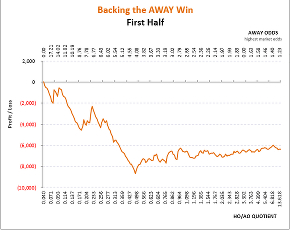
All of our bets will, therefore, be backing away underdogs to win.
Remembering the more vertical spike from earlier, you will see the odds there are far higher (between around 6.80 and 7.50). At these odds, it would only take one or two anomalous results to produce a misleading peak of this nature.
RESULT
In our campaign from 31/05 to 22/10/2019, there was a total of 12 bets satisfying the HO/AO criteria. Eight of these bets lost and four won. The odds of the bets placed ranged from 3.25 to 4.54.
Profit: £434.00
League 06) Japan: J-League 1
System 11 – 1st Half: Away Win
Medium-risk
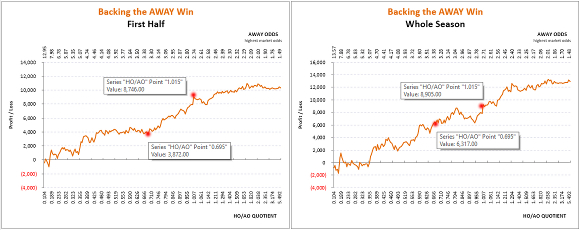
The 2nd half-season image suggests a reversal of fortunes between these marks.
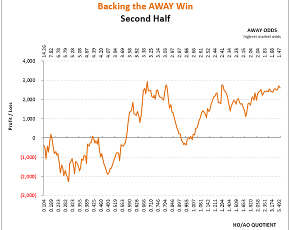
However, those over 1.000 (before 1.015) will be slight favourites to win.
Looking at the 1st half-season image, the odds range of our bet placements is likely to be between around 2.60 and 3.40.
It is worth noting that Japan always seems to contain an away win system in one half of the season or the other.
RESULT
In our campaign from 23/02 to 30/06/2019, there was a total of 42 bets satisfying the HO/AO criteria. 25 of these bets lost and 17 won. The odds of the bets placed ranged from 2.60 to 3.41.
Profit: £705.00
System 12 – 2nd Half: Draw
High-risk
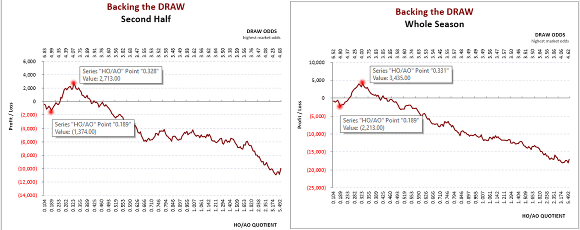
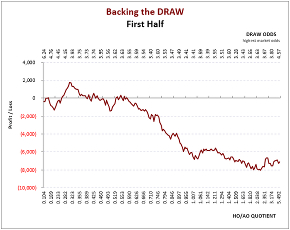
And, at this end of the scale, the matches included were likely to be between odds-on home favourites and longer-priced away underdogs.
But the fact the peak in the profit curve showed in both the 1st and 2nd half-season graphs was indicative of a good chance of repeated profits from this zone.
RESULT
In our campaign from 07/07 to 07/12/2019, there was a total of 12 bets satisfying the HO/AO criteria. Eight of these bets lost and four won. The odds of the bets placed ranged from 3.72 to 5.36.
Profit: £445.00
League 07) Norway: Eliteserien
System 13 – 1st Half: Home Win
Medium-risk
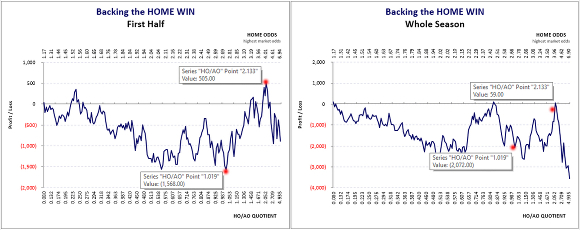
The 2nd half-season graph suggested half the size of reward between the same quotient points.
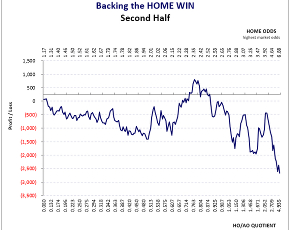
In reality, every bet would be backing a home underdog, although not a great distance apart from the away favourite odds.
The profit curve for the 1st half-season contains many jagged peaks and troughs and, at these odds, it was expected that more bets would lose than would win.
RESULT
In our campaign from 31/03 to 15/07/2019, there was a total of 29 bets satisfying the HO/AO criteria. 18 of these bets lost and 11 won. The odds of the bets placed ranged from 2.74 to 4.11.
Profit: £778.00
System 14 – 2nd Half: Away Win
High-risk
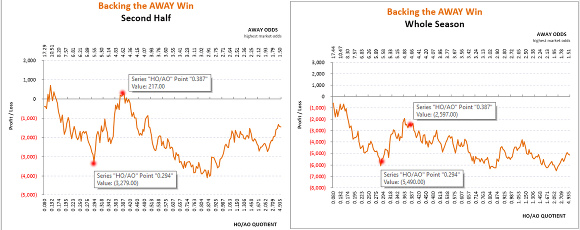
In the 1st half-season graph, there was a similar rise in the profit curve but the five-season haul was around 2,000 units.
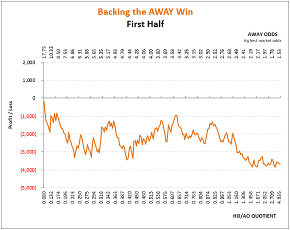
The part of the curve containing our system existed within a fairly narrow margin, so not many bets were expected.
But, at the odds highlighted in the graph, not many bets would need to win to turn a profit here.
RESULT
In our campaign from 04/08 to 01/12/2019, there was a total of 11 bets satisfying the HO/AO criteria. Eight of these bets lost and three won. The odds of the bets placed ranged from 4.55 to 5.56.
Profit: £348.00
League 08) South Korea: K League 1
System 15 – 1st Half: Draw
Medium-risk
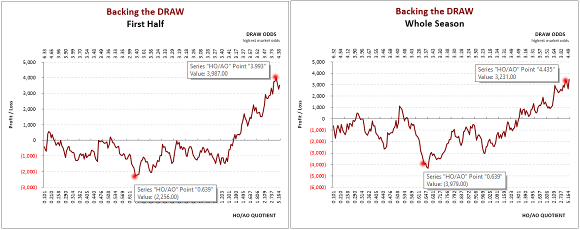
The 2nd half-season graph is once again very different in appearance.
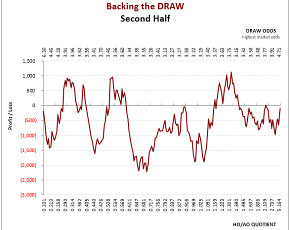
The potential rewards are large – around 6,000 units profit from the five-season historical trend or 1,200 per season on average.
The season is 228 matches in length. Our expectations were around 75 bets (66% of 114).
RESULT
In our campaign from 01/03 to 07/07/2019, there was a total of 79 bets satisfying the HO/AO criteria. 54 of these bets lost and 25 won. The odds of the bets placed ranged from 2.87 to 4.50.
Profit: £684.00
System 16 – 2nd Half: Draw
Medium-risk
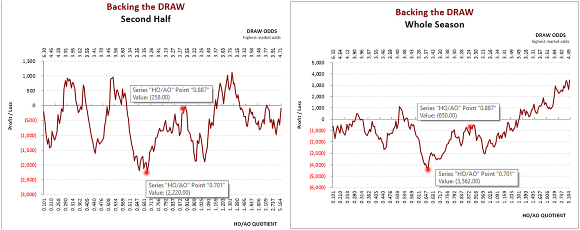
A reminder of the 1st half graph in isolation is shown below.
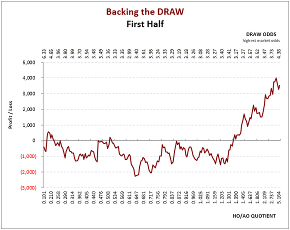
Here, we are looking at draws between well-matched teams, with the home team being the slight favourite in each case.
The quotients represent a small margin of the entire graph, so we are not expecting anywhere near as many bets as in the 1st half-season.
RESULT
In our campaign from 20/07 to 30/11/2019, there was a total of 14 bets satisfying the HO/AO criteria. Nine of these bets lost and five won. The odds of the bets placed ranged from 3.03 to 3.52.
Profit: £265.00
League 09) Sweden: Allsvenskan
System 17 – 1st Half: Draw
Medium-risk
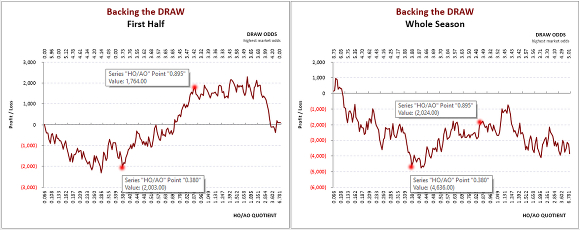
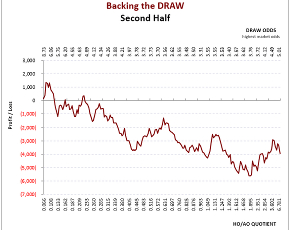
The feel from the odds range is that every match selected ‘could go either way’, which is always prime territory for backing the draw.
The five-season historical profit is over 3,750 units or around 750 on average per season.
RESULT
In our campaign from 01/04 to 15/07/2019, there was a total of 36 bets satisfying the HO/AO criteria. 19 of these bets lost and 17 won. The odds of the bets placed ranged from 2.99 to 3.80.
Profit: £2,100.00
System 18 – 2nd Half: Underdog
High-risk
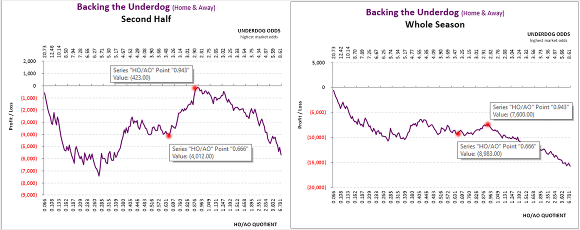
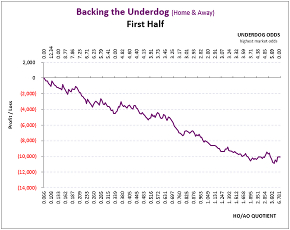
The ‘could go either way’ factor might be beneficial if enough underdogs prevail at the higher odds they ultimately must carry (i.e. more ‘value’) to offset the weight of money placed on the favourites.
The margins are once again narrow between 0.666 and 0.943, so not a huge number of games are expected to qualify for betting upon.
And underdog betting usually suits the second half of a season:
- Teams towards the lower echelons of a league tend to fight harder for survival
- Perhaps a team near the bottom has already faced most of its toughest matches in the first half of the programme and goes into the second half at misleadingly longer odds to win its games
RESULT
In our campaign from 20/07 to 28/10/2019, there was a total of 15 bets satisfying the HO/AO criteria. 10 of these bets lost and five won. The odds of the bets placed ranged from 2.74 to 3.45.
Profit: £68.00
League 10) U.S.A.: Major League Soccer
System 19 – 1st Half: Favourite
Medium-risk
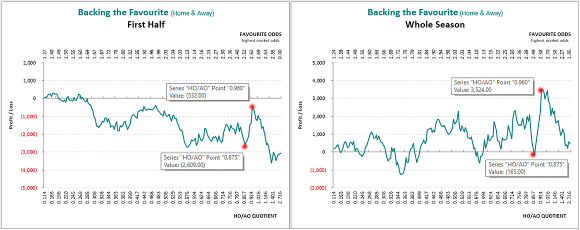
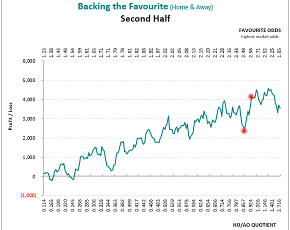
But from the historical perspective, this small zone has accrued over 2,000 units of profit in the previous five seasons.
All teams backed will be slight home favourites in very evenly matched games.
Neither many bets nor huge profits were expected.
With several hundred games in this league during a season, and with the format regularly changing (i.e. increasing numbers of teams in recent seasons) we felt that choosing systems in the M.L.S. with fewer potential selections would be better for the overall health of our portfolio.
RESULT
In our campaign from 31/03 to 02/06/2019, there was a total of five bets satisfying the HO/AO criteria. Three of these bets lost and two won. The odds of the bets placed ranged from 2.55 to 2.66.
Profit: £14.00
System 20 – 2nd Half: Home Win
Medium-risk
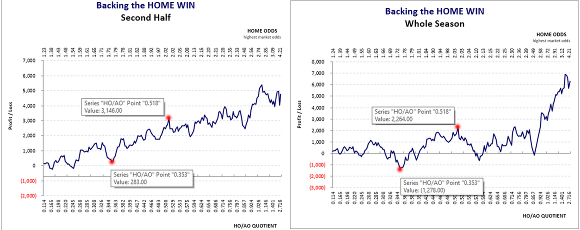
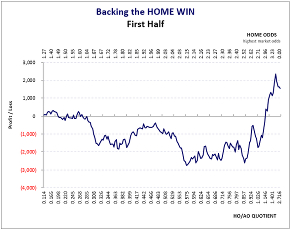
All of the bets expected will be home favourites at odds of 2.00 or below and above 1.60.
At these odds, the hit rate must remain high to make a profit knowing that approximately one-quarter of all games in the 2nd half-season will qualify for betting.
This is a medium-risk system with the potential for low gains. But, in keeping with our philosophy about concentrating upon more stable leagues, it also had the security of potentially low losses.
RESULT
In our campaign from 04/07 to 06/10/2019, there was a total of 40 bets satisfying the HO/AO criteria. 16 of these bets lost and 24 won. The odds of the bets placed ranged from 1.69 to 2.00.
Profit: £327.00
Conclusion
The overall profit total was pleasing and, to reiterate, the profit curve graph at the start of this article shows what would have been achieved with flat 100 unit stakes.
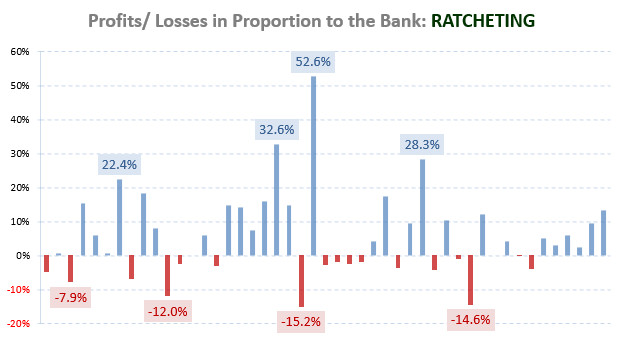
However, by using a ratcheting system to incrementally increase stakes in tandem with stop-loss stake reduction at 85% of the bank each round, the profit figure would have been almost 10k higher. Ratcheting without stop-loss in place, in this case, would have netted a figure almost 14k higher.
We will shortly be publishing an article showing an articulate staking plan in action on this portfolio of bets.
The hit rate achieved was just over 38% using predominantly medium and high-risk systems, with just one low-risk system in use.
But, it should be noted that 64% of the bets placed were low-medium risk (269 bets), whilst 36% were in high-risk systems (150 bets).
The longest losing streak was only nine bets (once). The longest winning streak was eight bets (twice).
Of course, the stark reality of the campaign sticks out like a sore thumb in the profit curve graph. Using flat stakes, betting could have been stopped in mid-September having achieved the level of profit registered by mid-December. In effect, the last three months of the portfolio were a zero-sum game. Hindsight always offers up a wonderful reality check.
Emphasis on Strategy
In a word, the strategy is diversification.
Using all 10 of the Summer League HDAFU tables available we decided this term to maximise the number of systems gleaned from them by choosing a 1st half and a 2nd half-season system from each league. In other words, using the 10 tables to come up with a total of 20 different systems.
(See 6) Example and Summary in this link to illustrate why we split the profit and loss curves into the halves of each season.
The other important reason for splitting each Summer League into two systems (and ignoring whole season systems in all Summer Leagues), is the fact that the leagues themselves are not as popular with punters as the main European leagues.
Because of the lack of demand in some areas of the Summer Leagues (i.e. less money wagered makes it harder for bookmakers to balance their book), odds are sometimes adversely affected with higher over-rounds: In other words, there are less ‘value’ opportunities available for punters.
In addition, a tendency exists for bookmakers to react to historical results trends at the beginning of a new season by lowering odds across the board to counter the efficacy of punters trying to take advantage of them.
Therefore, without the ability to second-guess what is likely to happen with the odds trends in games not yet played, by concentrating on one bet type in any league for no longer than half a season, the chances of picking a system discriminated against by the bookmakers are minimised as much as is possible.
Also, if a system is going to go wrong, then better to limit the damage to half a season, rather then endure the misery of continuing losses (and hoping in vain that they improve) throughout the full term.
Final Words
Soccerwidow uses the term ‘Summer Leagues’ to describe those where the season begins and ends during the same calendar year.
In other words, leagues outside the usual format of those beginning in one calendar year and completing in the next (what we call ‘Winter Leagues’).
Although our own HDAFU campaigns are traditionally a mixture of ‘Summer’ and ‘Winter’ leagues it is difficult to provide a summary of the whole due to its overlapping and ever-running nature. In effect, the Soccerwidow campaign is one long, never-ending portfolio: The betting equivalent of perpetual motion.
In this way, it is as close to the bookmakers’ own business model as possible but on a micro-level by comparison.
Bear in mind that with the Winter League portfolio running concurrently, this article represents an isolated snapshot of what happened to our Summer Leagues during the time frame represented by 419 bets placed in 10 leagues (20 systems) over a period of 288 days from the 22nd of February to the 7th of December 2019, both dates inclusive.
Here again, is that free download link – Click on the button below to get your 2019 Summer League Campaign spreadsheet.
>>> 2019 summer league campaign <<<
(Then click on the green Checkout button, fill in your name/email address details and press Submit Order. A download link will then be sent to your email address – and it won’t cost you a penny! Check your junk mail if it doesn’t arrive in your inbox immediately).
When buying this spreadsheet you will also receive a coupon code offering a discount of £7.00 GBP, redeemable against the purchase of any individual HDAFU Table. This allows you the opportunity to experiment and explore your first HDAFU Table without paying the full price for it and before you commit to buying more – formulate strategies for any current season ‘on the cheap’!
Buy your tables in the Soccerwidow HDAFU Store (heavily discounted bundles of 5, 10, 15, 25 leagues also now available!)
Coronavirus Thoughts
The effects of coronavirus on the various leagues around the world are still unknown.
After the March 2011 Tsunami in Japan, the J1-League was halted for seven weeks. When the league restarted it assumed exactly the same statistical pattern as expected from previous seasons: the elongated break between rounds had no effects on the trends of the observed results (although only one round of matches had been played in the 2011 season up to that moment).
Coronavirus has suspended leagues for far longer and at a different point in each, and the possibility of many leagues resuming against a backdrop of empty stadia is another factor to consider. Will home advantage be to some extent neutralized by the lack of fans?
All in all, differences like this may affect individual results but, from a statistical perspective, previous trends will in all likelihood remain evident. But don’t hold us to that.
Whilst things stabilize around the world it is probably better to pause betting portfolios for a while and monitor your systems on paper. However, Value Calculation and Over/Under goal betting are probably still valid as the concepts are applied to and rely on calculating each game individually.
Stay safe.


