It makes sense, doesn’t it? Predicting the result of a full 90-minute match has to be harder than predicting the outcome of just the first half.
Logically speaking, any full-time (FT) football betting strategy must be riskier than betting on the half-time (HT) market as there is more time for a result to go against you.
On the contrary, you can of course say there is more time for the result to go in your direction, but the old cliché, ‘It’s a game of two halves’, is never more appropriate than when looking at the stark differences between HT and FT betting.
Major Differences between HT and FT Statistics
1. Goal Distribution
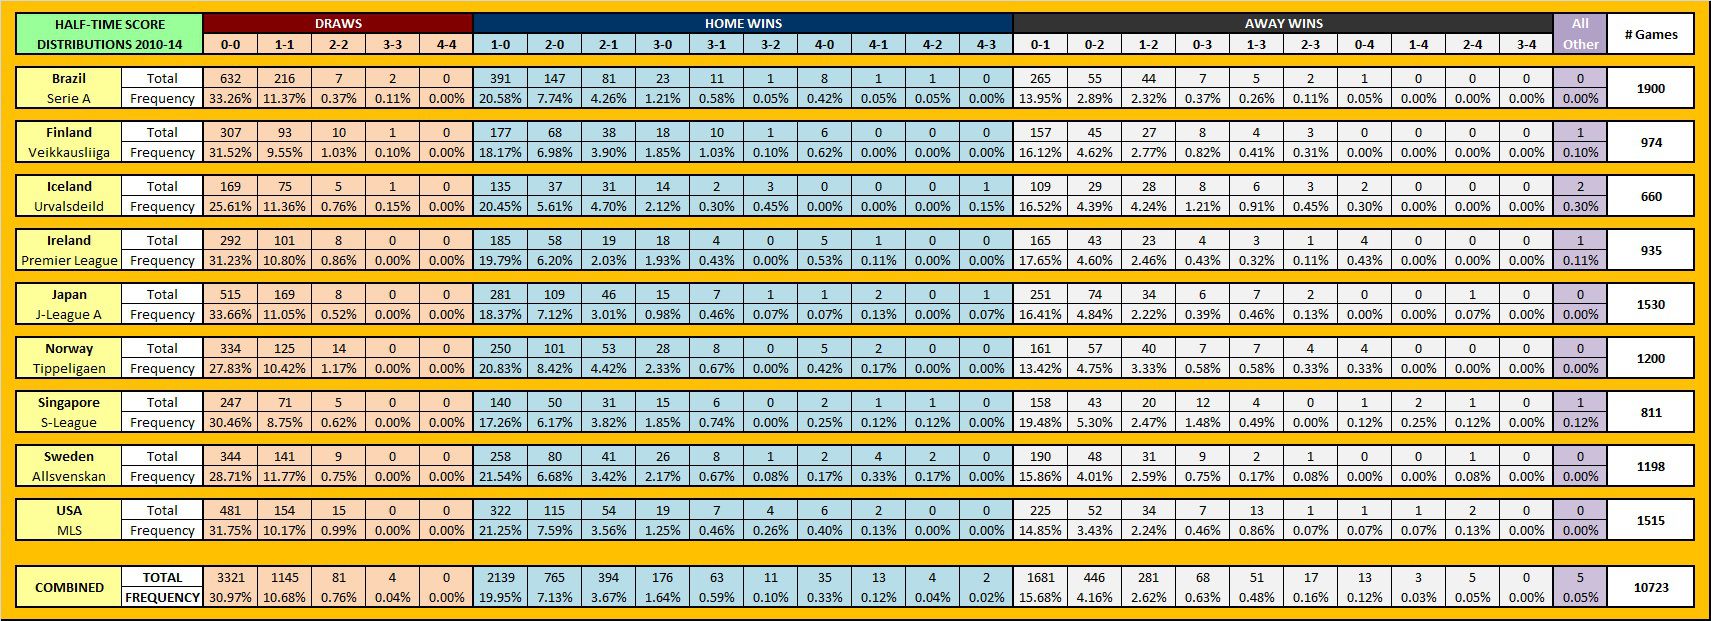
Compared to FT goals totals there are naturally fewer goals in the first halves of games in every league you can possibly analyse.
The HT goals data set produces higher concentrations of correct score frequencies within a tighter range of outcomes than the FT market. Fewer goals also mean higher and tighter under/over ‘X’ goals frequencies, and indeed, every other HT goal related market.
FT scores are far less predictable due to a wider variety of actual outcomes and the significance of the FT data set is more diluted as even the most populated correct score clusters contain fewer results than the most populated HT score clusters.
Thus, a larger pool of statistics is needed for FT analyses before the cluster groups can be considered as being significantly populated.
2. HT and FT 1×2 Results
First Half Mentality:
It is a hard fact that no game can be won in the first half. For many teams the first half is all about containment and reserving energy for the more decisive second period of play.
The first halves of so many matches see teams cancelling each other – underlying fitness is more evenly matched between the teams at the beginning of a game.
It is undeniable that players are physiologically fresher at the start of the first half than they are at the beginning of the second period.
Mentality may also be affected knowing that there is always the second half in which to make up for mistakes and/or missed opportunities in the first.
Whatever the reasons for first half deadlock it is a fact that the draw is the most common HT 1×2 result in every league and in every season.
Second Half Mentality:
The second half will always be played under different circumstances to the first.
Rarely do you see teams ‘throwing the kitchen sink’ in the first half. Typically, this is a second half ploy seen towards the end of games when, if it reaps rewards, there is little time for the other team to hit back.
The bigger, richer clubs can afford better training and medical facilities, which means fitter players. Player fitness levels tend to be more of a factor the longer the game goes on.
Tactical substitutions are normally performed in the second halves of matches when fresh legs versus tiring ones can make all the difference.
Fitness can have even more of an effect on the FT outcome if a team is playing within three days of their last match (as it is medically acknowledged that players need at least three days to recover between games).
An example of this fatigue syndrome is the ‘European hangover’ seemingly suffered by teams playing midweek European competition games. No matter how large their squads are, there are always a noticeable number of below par domestic performances from these teams the following weekend.
And of course, successful teams tend to play more games per season than not so successful ones.
The most common FT 1×2 result is the home win but not in every league in every season (i.e. more volatile).
3. Favourites and Underdogs
The majority of bettors are usually driven by a desire to back the nailed-on favourites, especially when looking at less popular or more obscure leagues.
But greater value is more often found in the underdog market, predominantly so in less popular leagues where favourites tend to be perennially under-priced (appearing to be heavier favourites than they really are). In response, underdog prices are over-priced (indicating a smaller chance of winning the game than they actually have).
Underdogs tend to perform better in the first halves of games. Usually their mentality is to ‘have a go’ from the start rather than sit back and wait to be beaten by a better team on paper. They have nothing to lose.
Unfortunately for them, underdogs don’t often see the job through to the end. The FT underdog market does perform well in some leagues but often not as well as it does at HT in those same leagues.
The draw is usually the shortest priced event at HT except when overwhelming favourites play rank outsiders; the draw then becomes the second shortest price. The 0-0 draw is the most common HT result in every league and in every season.
In the FT market, the favourite is always either the home team or the away team, never the draw, although we will see from our example on the next page that the 1-1 draw is the most common FT score in almost every league.


Hello! It’s nice article
What strategy can i use to predict half time odds?
Nice writeup. I am deeply involved in betting for Under 1.5 HT and Under 2.5 FT. is there a better system or method of predicting such games in different leagues? A quick response is hereby needed, please.
Thanks.
I am from Nigeria how can I obtain the current 12X system for English weekend fulltime football pools fixed odds coupon 2017/18 season
Thanks
Hello Victor,
If you are looking to analyse individual games, then perhaps the Value & Probability Calculator is something to consider.
If it is a system you wish to follow, then the HDAFU Tables are the product to go for.
Good luck and thanks for your question!
Is there an easier way to use oddsportal to gather historical data for markets other than 1×2?
With 1×2 I can copy and paste the full page and then tidy up in excel with text to columns etc but for other markets you have to spend time going into every single match?
JM,
Yes, you are exactly right with the 1×2 market in Oddsportal – Copy and paste each page and then tidy-up in Excel. Each season takes about 12-15 minutes to prepare in this manner.
Any bet type other than full-time 1×2 is unfortunately a manual job where odds have to be scraped individually.
Apart from football-data.co.uk (free) and football-bet-data.com (subscription), I am unaware of any other service providing historical odds.
Betexplorer.com is owned by the same group as Oddsportal, so the fare on both sites should be identical.
The big problem with all of these services is that their respective API’s responsible for collecting the data are unreliable.
Some bookmakers’ odds never get updated from their original opening price, whilst others keep updating long after the match has kicked off.
Of course, this distorts the real picture.
Oddsportal odds must therefore be checked to iron out these anomalies. The easiest way of doing this is to set-up overround calculations to spot the sets of odds which are obviously out of sync.
Getting reliable odds data is the most time-consuming part of our analyses.
Thanks for your question and I hope the answer is of assistance.
Hello Marius,
Thanks for your question.
The best site for historical results and stats is http://www.oddsportal.com – this is where you will find what you are looking for. They have a huge database of archived odds and results.
Otherwise, check out our article on FT and HT simulation tables – both types of table contain all the historical odds and results from the last five complete seasons in each league available.
Enjoy your weekend too!
Hello,
i like this article and understand the process. But where can I find the historical half-time odds and results? Is there a website where i can find them?
Have a nice sunday!