A fortnight ago I explained the popular football betting strategy: System X1. This is a combination bet of draw/home on the half-time and full-time results of a game using a picking criteria of games between evenly matched teams in terms of their odds. Because the HT/FT draw/home odds of each fixture were different, stakes were weighted on each of the selected 10 games to ensure equal returns and to smooth losses.
Now the moment of truth has arrived: Does this system work in practice?
 Image: alphaspirit (Shutterstock)
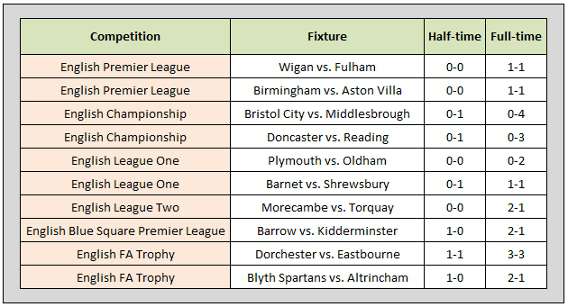
The match results of the chosen games were as follows:

From the 10 chosen matches, 5 (50%) were drawn at half-time, meaning that only these had a chance of winning, whilst the other 5 bets were already lost by half-time. Eventually only one game (10% of total) ended in a draw/home HT/FT result.
Thus, from a total of 10 bets, 9 lost and only 1 won, which meant an overall financial result in this case of MINUS £46.40.
A breakdown of the individual home, draw and away results in each half of the chosen games is shown in the table below:

At half-time 2 home teams were leading, 5 were drawing and 3 losing. This ratio changed only slightly at the end of the matches:
- 30% of the matches ended with a home victory
- 40% ended in a draw
- 30% ended in an away win
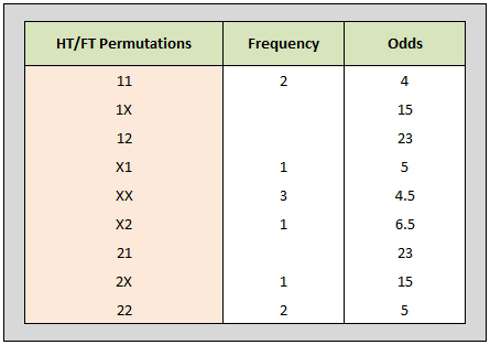
The table below shows the distribution of our 10 results throughout the 9 different half-time/full-time combinations:

So, our sample produced:
- 3 x draw/draw (XX)
- 2 x home/home (11)
- 2 x away/away (22)
- 1 x draw/home (X1)
- 1 x draw/away (X2)
- 1 x away/draw (2X)
- 0 x home/draw (1X)
- 0 x home/away (12)
- 0 x away/home (21)
Of course, there is no surprise that there were no outcomes in the home/draw, home/away or away/home categories as these combinations are traditionally the highest priced (statistically less frequent) events.
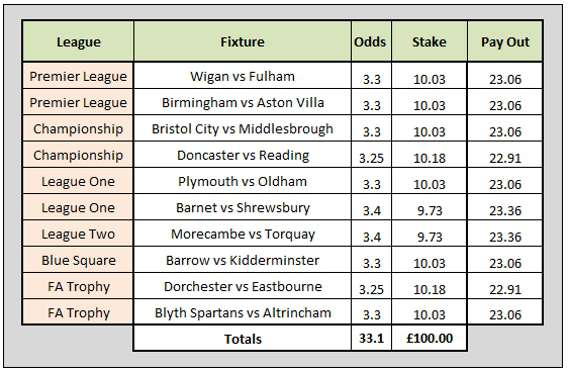
Had I bet purely on the full-time draw instead of the draw/home combination then the loss of £46.60 would have turned into a profit of £32.37. The weighted stake table is shown below:

The payouts would have been:
- -£100.00 if none of the matches had ended in a draw (total loss of whole stake)
- -£66.91 if just 1 match ended in a draw
- -£33.81 if 2 matches ended all-square
- -£0.72 for 3 draws
- £32.37 profit for 4 drawn games
Therefore, are the half-time/full-time combination bets only good for bookmakers?
Since 10 bets on their own are a statistically insignificant amount, I have selected another 10 games for 22 January, 2011. The observation will be exactly the same as before on the basis of equally matched teams in English football.
In my first sample, draw/draw (XX) was the most frequent result (30% of the 10 selections) and the new experiment will add this combination to the original draw/home permutation whilst also including home/home and away/away, plus the full-time draw result in isolation.
The selections for this second test are on the next page…


Very interesting analysis pertaining to the HT/FT betting differences, etc. I appreciate your effort in doing all this and making it public knowledge.
Alex (sleepless in Seattle)