How Does This League Stack Up?
In the grand scheme of things this system is definitely one we would consider including in our portfolio.
The only things worth noting are the low hit-rate five seasons back, which produced the one losing season.
Also, the fact that the number of games to bet on was the smallest in the most recent season despite its relatively good hit-rate.
This may be an indication of a different approach by the bookmakers to odds-setting in this league that season.
What to be Wary of
Any deteriorating trends are a worrying sign that all is not well.
Likewise, if a league has a big profitable anomaly in one season, consider it for inclusion in your portfolio only if the other three or four seasons show healthy profits too (if not quite so large as the anomaly).
However, if it sticks out like a sore thumb (e.g. it supports the whole system more than the other four seasons put together), then try and find something better.
What Next?
If you are happy with a system, then stick with it. Personally, we check everything that looks appealing in a league and make a decision on what is best.
With our example system, we would have performed a separate analysis of that part of the rising curve immediately before the big dip after odds of 3.55, to see what differences it made.
Because the remaining portion of our curve would become more stable as a result (i.e. no big troughs of any note), we imagine that although the profit figures will change (they may reduce or even increase), the maximum expected losing streak will improve, as will the hit-rate, with more consistency among all five seasons. We may even see all five seasons in profit.
And if you don’t know by now, we even go to the lengths of analysing the first halves of the seasons and the second halves separately.
For us, because we know what we’re doing, the whole exercise you have read about in this article usually takes no more than 15 minutes.
For one league, we will probably analyse 6-8 systems using all three HDAFU tables for that league to find the best one (whole season analysis) or two systems (first and second half season analyses). For us, this is a 1-2 hour job per league.
Step 5 – Identifying the Risk of your Potential System
The next step involves classifying the ‘risk’ of your potential system.
On the first page of our Winter League Campaign article, we discussed ‘Measures of Risk’ and what our parameters are for allocating a risk label to a system in order to build a balanced and thus, healthy portfolio.
Everyone has his own level of risk acceptance and measurement. By all means feel free to follow our suggestions for the cut-off points between what we categorise as low, low-medium, medium, medium-high, and high risk systems. But please don’t feel these are set in stone. They are suggestions based on what has worked for us in the past but everyone’s portfolio choices are likely to be different, and what works for us in terms of our own attitude towards risk, may not work for you.
On page four of the same article, you will find how our portfolio was spread between the different divisions of risk and you will see that it was fairly evenly distributed.
And so, the ‘Seasonal Harmonic Mean Trends’ tool introduced in the 2018 Summer League Tables (not available in the 2016-17 Winter League Tables) is a short-cut to gauging the risk of your filtered systems and will enable you to juggle, mix and match until you find an acceptable balance for the whole portfolio.
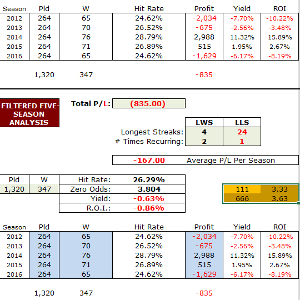
The tool is adjacent to the benchmark and filtered five seasons analyses, under columns P-W in the data tab and here is a screenshot showing the unfiltered figures:
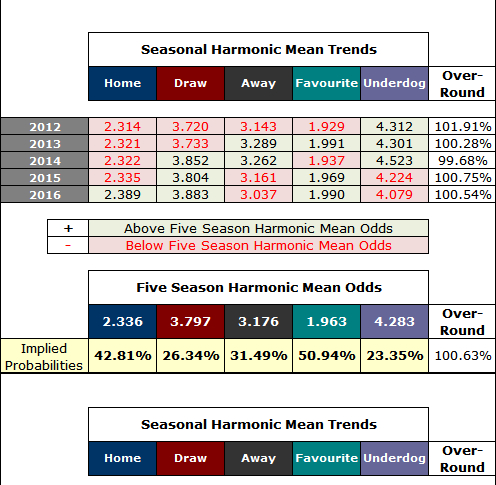
You can see that for the draw, the overall harmonic mean odds for the entire five seasons’ data set are 3.797. This equates to an implied probability of 26.34% (100/3.797).
As such, betting on every game to be a draw over five seasons (as this is the unfiltered data) would qualify as a ‘medium risk’ system under our rules of categorisation.
You will also see the individual figures per season above as 3.720 for 2012; 3.733 for 2013; 3.852 for 2014; 3.804 for 2015; 3.883 for 2016. These cells are highlighted green if above the overall figure of 3.797, or pink if below it.
Look at the trend. What does it tell you? The last three seasons are all green, which indicates that odds for the draw have collectively been above the harmonic mean.
If you compare this with hit-rate in the unfiltered analysis, you will see that it has in fact been reducing in each of the last three seasons: 28.79% in 2014; 26.89% in 2015; 24.62% in 2016. This may account for why the odds have been higher in these three seasons than the overall harmonic mean figure: The draw has become scarcer and the odds for it have naturally risen piecemeal as a result.
Filtering the Harmonic Mean Trends
We are looking at the draw, so you can hide columns R, T, U, and V, although for the sake of clarity we will continue to show all the bet types.
Simply click on the five cells for each season in the draw column (black outlined cells below) and carry out the same number substitutions you performed in the previous steps. Substitute 10 for 111 and 1329 for 666 in each of the five cells.
Do the same with the overall harmonic mean figure below these, in this case cell S1372. In the screenshot below, we have hidden a few rows so that you can see both sets of draw figures (the unfiltered above and the filtered below). The home, away, favourite and underdog figures are untouched but if you want an accurate overround comparison too (not vital) then do the number substitutions in the home and away cells too:

After filtering, the system still falls into medium risk allocation.
Looking in more detail, the last three seasons’ harmonic means are much closer together in comparison to their unfiltered results, and hit-rate has also remained pretty stable during this time: 33.04% in 2014; 34.71% in 2015; 33.67% in 2016.
It’s this type of stability in the longer term to look for when deciding upon which systems to choose as part of an overall campaign. Finding stability like this in the last three seasons of any analysis is a good benchmark.
As mentioned, with experience it will take you no more than 15 minutes to analyse a bet type in any particular league. There are three tables per league and you may find two or three things of interest in each table.
Once you have the candidates from each league, the acid test in deciding which one or two to use is all about scrutinising the details.
Looking at trends in the seasonal harmonic mean figures is an excellent method of shedding more light on what has been going on historically in a league or a particular odds cluster within it. Identifying big swings here is certainly an indication of wholesale changes in bookmaker approaches to a league based on changing statistical trends in the match results and/or popularity of a league.
I would recommend you spend as much time looking at the odds and hit-rate trends as you do in filtering the analyses. Write down all the pros and cons of each system and put them in hierarchical order.
Mixing and matching systems from all the different leagues you choose in order to compile one large, balanced portfolio is definitely an art form. It may take you a season or two to master it, but the tools are here and in the long-run you should make good money with these strategies.
Next Page: Step 6 – Bet Selection, Conclusion and Business Models


Hi,
When will the 2018-19 winter league tables be available for purchase?
Thanks.
Hi Simon,
our deadline is to publish the tables for the 2018-19 season the next two weeks.