Odds Correction Exercise Solution
Odds Correction Excel Spreadsheet
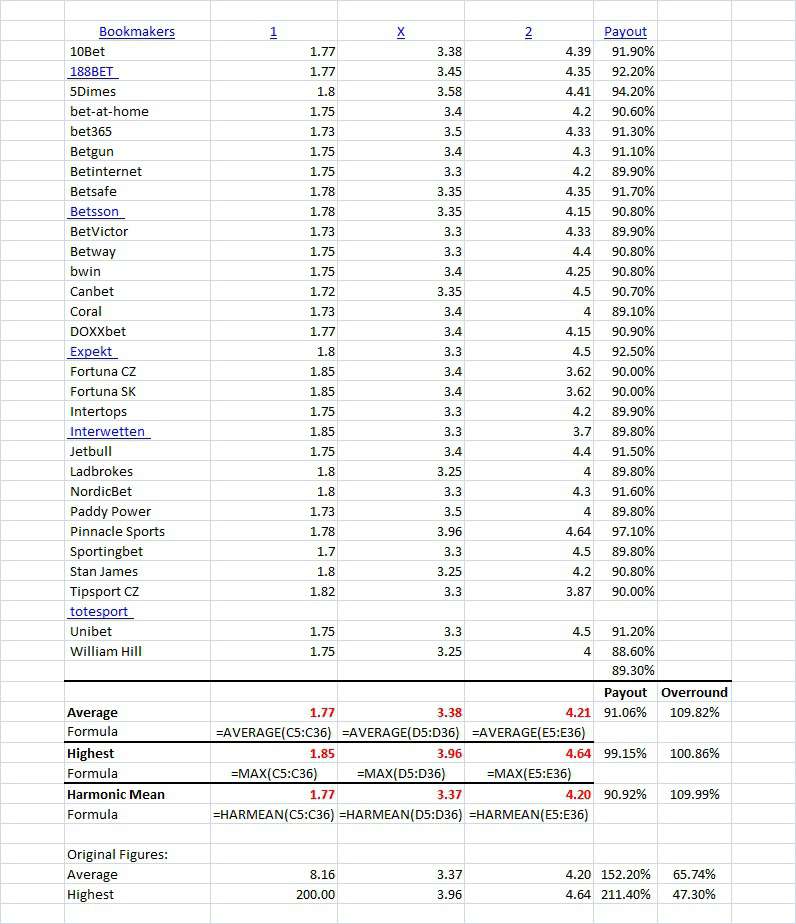
The screenshot on the right shows how the Excel spreadsheet looks.
You know the drill – click on the image to enlarge it in a new tab and then use the magnifier provided to increase the size further.
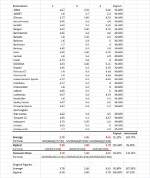
As you can see, the average prices for the 1×2 full-time results are now shown as 1.70, 3.45, and 4.55, respectively.
The highest prices for these events are now shown as 1.90, 3.80, and 5.70, respectively.
If you worked the results out manually in your head or using a calculator then you will not have arrived at some of the figures above.
Our Excel spreadsheet uses only the figures to two decimal places shown in Oddsportal’s screen and we have no way of knowing how their rounding-up method is programmed or to how many decimal places they work.
Indeed, this is confirmed by our harmonic mean figures of 1.70, 3.44, and 4.47, respectively: few of our calculations exactly equal the summary figures offered by Oddsportal, with or without the errant odds shown for Sportingbet.
We made no amendments to the away win prices yet our average price shows 4.55, whilst Oddsportal’s was 4.41. This is a big difference if repeated in each of the 180 league games in a season in the Swiss Super League and a reminder that you should never take published figures for granted. There will always be room for error.
The highest prices are unchanged except for that home win discrepancy. Instead of 4.30, the adjusted highest price is 1.90, and the Payout figure (not the bookmaker’s overround) is now more acceptable at 103.64%.
Free Download – Odds Correction Excel Spreadsheet
The spreadsheet we have used including the formulas automatically inserted for average and highest odds determination, the harmonic mean, and the formulas for calculating “Payout” and “Overround” is available below as a free download. (Check out our article on accumulator bets to understand the significance of ‘overround’ and how damaging it can be)
or
11.3 kb .xlsx (2007+ Excel format)
(both spreadsheets contain the same information).
In return for this freebie we would appreciate if you could share this article via your social network or give us a ‘thumbs-up’ with a ‘love’ or ‘like’ via Twitter or Facebook 🙂
Odds Correction Exercise
In the final section we show you a screenshot from another Oddsportal match with distorted odds and invite you to try out your newly learned skills to correct the glaring errors…
Identify and Correct the Odds Errors
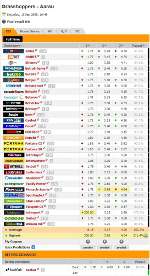
Even to the untrained eye, the error in the following table is obvious.
Click on the image below to enlarge it in a new tab and then use the magnifier provided to increase the size further:
Whether the erroneous figure has been mistyped or it comes from somewhere else entirely we do not know.
Using what you have learned so far, re-calculate the average, highest, and harmonic mean odds with the 1×2 odds of Totesport completely removed from the table.
If you have not registered with Oddsportal and selected “All Bookmakers”, then you will not have the benefit of seeing all the prices shown in our screenshot. Got to our Oddsportal introductory article for tips on how to do this.
The only downside to registering with Oddsportal is the occasional receipt of spam emails from their affiliate partners, but the benefits of using their resource of historical results and data far outweighs this small inconvenience.
Odds Correction Exercise Solution
Have you done it?
Okay, here is the solution.
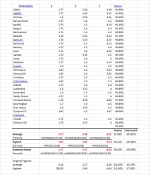
Click on the image below to enlarge it in a new tab and then use the magnifier provided to increase the size further:
For a more detailed overview of data collection requirements for optimum results visit our article about the correct assignment of football data in relation to all the possible levels of measurement.
It’s an eye-opening document and will prevent you from false beliefs and wrong practice when it comes to analysing data.
Hopefully you will have gained some additional knowledge from this article.
As ever, should you have any queries or comments to make, please use the ‘Leave A Reply’ box at the bottom of this page.

