The Nutty Professors:
Congratulations to those ‘mad’ scientists at the International School of Management (ISM) in Frankfurt and the German Sports University in Cologne whose predictions we followed throughout Euro 2012.
 Image: Pikoso.kz (Shutterstock)
Those of you who also followed suit reaped the benefits of their statistical predictions realising a yield of between 19.7% and 25.5% depending upon which style of staking plan you employed (either fixed stake or fixed risk/win).
However, some of their prophecies did not materialise…
For example, co-hosts Poland did not make the semi-finals.
There were plenty of goals in the England v. Sweden match but not a huge goal difference for England and in the end they struggled to win at all.
Alas, the scientists’ beloved Germany did not get a chance to dethrone the defending champions in the final despite saying, “chance, luck and statistics are favouring zis”.
Never-ze-less, ze predictions from ze Frankfurt and Cologne think-tanks produced handsome profits.
As mentioned in our original article not all predictions will win. Indeed, it would have been miraculous if they had all won as the mathematical likelihood was just 0.00000031% (326 million to 1 – that’s definitely the way to bankrupt the bookies!).
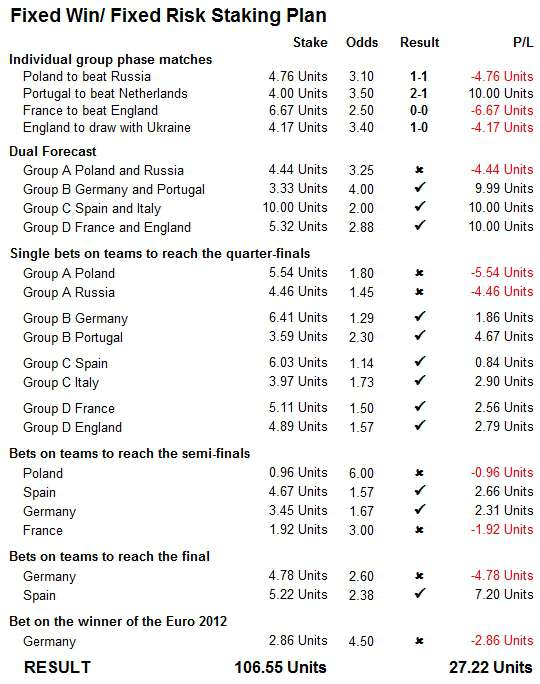
Soccerwidow’s pre-tournament profit/loss estimation of the scientists’ predictions using a fixed risk/fixed win staking plan:
Total risk of all bets (stakes): 106.55 Units
Maximum potential profit: 140.52 Units
Realistically expected profit (10%-15% yield): 10.66 to 15.98 Units
However, things turned out better than expected with profits of 27.22 units (25.5% yield) based on our favoured fixed risk/fixed win staking plan:


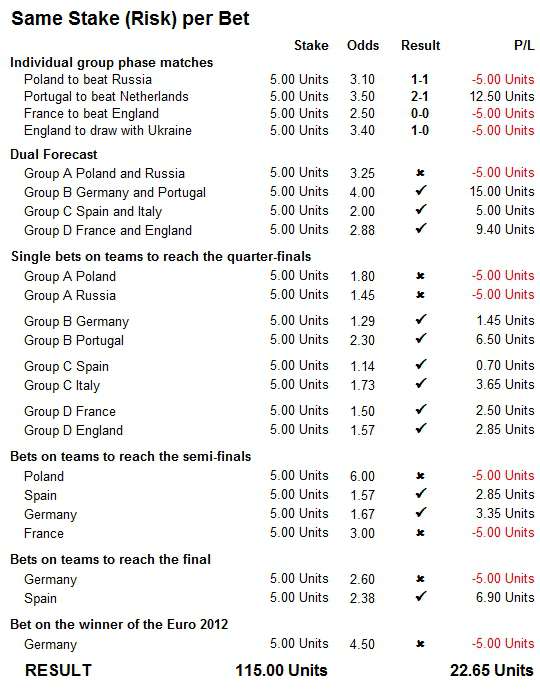
The second table represents the same bets using a fixed stake staking plan.
We feel that a Fixed win/Fixed Risk staking plan is the most solid and reliable form of staking for maximised profits and minimised losses, and we have just found this article Raceadvisor.co.uk: Fixed Profits or Fixed Stakes? which includes a mathematical experiment comparing a fixed stake with a fixed risk/win staking plan. It’s an interesting read and a similar outcome to our own findings.
However, the Fixed Stake Staking Plan tends to be a more popular method and although this would have also brought a nice profit of 22.65 units (19.7% yield), the Fixed win/Fixed Risk staking plan remains ‘smarter’ in our humble opinion.
Staking Plan Excel Spreadsheet for Download
If you would like to analyse these calculations in a little more detail you can download our Excel spreadsheet which complements the above tables, free of charge. However, please kindly return the favour and either Twitter this article, like it on Facebook, or Google+ it. 🙂
Excelspreadsheet Euro 2012 Simulation – Staking Plan Comparison
Famous Last Words
In our original ‘mad scientists’ article we recommended a fixed win/fixed risk staking plan and as we have seen, this method performed better than a fixed stake staking plan.
However, both staking plans produced fairly similar results due mainly to the fact that betting odds between 1.5 and 3.5 were in play. Especially at the lower odds the differences between the stake amounts in both plans were not huge, which ultimately led to similar results.
Whichever staking plan you choose is down to you and it then remains to follow it religiously without emotion and to never chase losses…
If you now have a great void in your life following the completion of Euro 2012, instead of developing withdrawal symptoms or falling into post-Euro 2012 depression, remember that you always have therapy available by reading this blog from cover to cover. Then, if you are very brave you may wish to dive into Soccerwidow’s Fundamentals of Sports Betting course in order to learn the skills of professional odds calculation and prepare yourself for next season!


Shouldn’t we always stake fix amount of units for short odds?
Hi, is the fixed win/ fix risk staking plan simply means risk maximum ‘x’ unit and win maximum ‘x’ unit? If so, how come you staked in the above example, 5.54 units @1.80 for ‘Group A – Poland’. Shouldn’t we according to plan suggested, stake fix amount of units in short odds?
Thank you
Sorry for your trouble. It’s done 🙂
After sharing this article on FB and Twitter! the Staking Plan Excel Spreadsheet DID NOT magically appear!! Please can you email it to me, it’s of great interest. Thank you.