
Here’s the link to the new sales page: HDAFU Inflection Points Tables
As you may already know from our 2017 Summer League tables, you now receive three separate tables for each league purchased. (Except Australia, see below).
Why? Well, we had an idea in early 2016 and experimented with it. Read about that brainwave here.
Why should I buy them?
Because they are the most effective and successful method we know of building a lucrative portfolio of bets targeting the sweet spots in the odds range. Read about our successful Summer League campaign here and our successful Winter League campaign here.
How do I use them?
Full instructions plus a free HDAFU table download is available here.
You can mix Winter and Summer League tables in your order, and don’t forget to apply the discount codes for multiple purchases. (See green box immediately below).
Buy Your Tables Here!
PRICE(*): £35.00 GBP Per League
The following discounts apply for multiple purchases:
Buy 5, 6, 7, 8 or 9 leagues = 20% Discount (coupon code: SW20)
Buy 10 leagues = 30% Discount (10 for the price of seven) (coupon code: SW30)
Buy 11 or more leagues = 35% Discount (coupon code: SW35)
Please contact us (sales[at]soccerwidow[dot]com) should you have any questions regarding checkout and payment. For further clarification about the HDAFU tables please use the comment function below.
Should any of the above codes not work for any reason (It’s Javascript and some browsers may prevent the lightbox opening) please use the basic version of the cart to purchase your HDAFU Simulation Tables
The tables for sale are in Excel .XLSX format. Should you require a different format,
please feel free to get in touch with us by email.
(*)Prices are net prices ex VAT (Value Added Tax).
EU VAT rates will be added on the checkout page according to your location if in Europe.
Customers from the United Kingdom currently are not charged any VAT
Read more: EU VAT Information
Help with the Checkout
Open the scroll down list and click a league to highlight it.
Click on the Add to Cart button to include the item in your shopping basket.
Click Continue Shopping to add more items to your cart.
When you are ready to checkout, add your discount code (coupon code) if applicable (see multiple purchase discounts below), and click on Update Cart to register your discount.
Enter your personal details before clicking Continue Checkout at the bottom of the window.
You will then be given a choice of paying with PayPal or your credit card (via Stripe).
Contact us if you wish to pay via Skrill, Neteller or bank transfer.
Upon payment, download links for the files you have purchased will be automatically sent to your email address.
What You Get for Your Money
Instead of the usual one HDAFU table per league, you now get three. (Except Australia A-League, which is a whole season analysis only due to its size and lack of any recognisable mid-season break. The price of this table is now reduced to £10.00 GBP).
The new style tables presented here are also optimised for easy filtering.
Our recommendation is for a set of systems in several leagues, enough to provide you with a portfolio of at least 500 bets in a season. You’ll then have a chance of emulating our 2016 campaign.
Frequently Asked Questions
Is there a time restriction on the usefulness of the HDAFU tables?
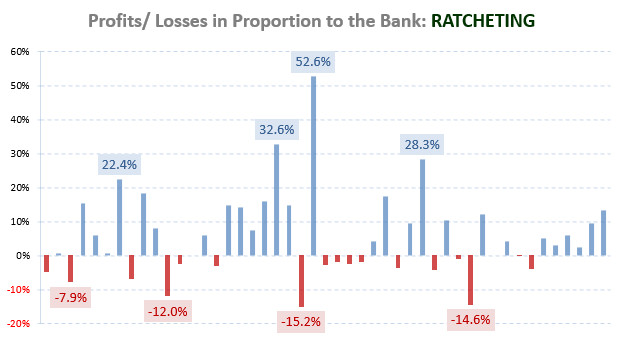
The tables simulate the profits and losses by betting type for the last five complete seasons if choosing the same bet type for every game of the season. Therefore, the ‘natural’ cut-off point is the end of the following season when the tables have to be re-calibrated.
Simulating the profit/losses when betting on the same outcome over the last five seasons, the tables show a picture of the likely (expected) distribution for the forthcoming season.
If the bettor chooses a distribution which is equally spread over the year (e.g. underdogs in the German Bundesliga with odds between 4.0 and 17.0), then it doesn’t really matter when the systematic betting starts.
The HDAFU tables are a great help at any time throughout the season to provide focus upon profitable areas within your chosen league and allow you to refine your final bet selections.
Further reading:
Probability, Expectation, Hit Rate, Value, Mathematical Advantage: Explained
Avoid Placing Bets at the Start of Season
What is the relationship between the HDAFU tables and the Value Bet Detector?
The HDAFU tables simulate profit/losses when betting systematically on one specific bet type, e.g. backing the home win, the draw, the away win, the favourite or the underdog. The Value Bet Detector is an odds and probability calculation tool for individual/particular matches of interest.
Both tools originate from the time Soccerwidow wrote match previews for Betfair and needed to identify games containing value bets for analysis. Here is a summary of those predictions.
The HDAFU tables were initially developed as a tool to recognise clusters of matches that were far more likely to contain value bets, and thus provide filtered sets of matches to preview.
We often receive questions such as, “Can the HDAFU tables and the Value Calculator support each other?” or, “What is the relevance of the HDAFU tables?” or, “Which methodology is better?”
Ultimately, both products are tools for odds calculation and understanding the betting market. The Value Bet detector is an analysis tool for individual matches; the HDAFU simulation tables is better for systematic betting in larger numbers.
Further reading:
How do Bookmakers Tick? How & Why do they Set Their Odds as they do?
How Bookmakers’ Odds Match Public Opinion
How do I structure a portfolio and what is the best size for it?
“A portfolio is a package of bets where extensive analysis has determined the choices (picks)… This is an essential part of the whole betting strategy in order to reduce the risks of losing by diversifying.”
Now focus on the main expressions: extensive analysis… determined choices… whole betting strategy… reduce risks… and lastly… diversifying.
Actually, there is nothing more to say. Just spend some quality thinking time on it.
It totally depends on personal preferences, on the availability of betting markets to you, on your risk awareness, your understanding of probabilities and statistics, and finally, using all of this combined knowledge to make your best personal judgement, never losing sight of the fact that the bottom line is making profits.
Further reading:
Calculating Odds for League Newcomers is Unpredictable
1×2 Football Betting – How to Compile a Winning Portfolio
Are the HDAFU tables for both, back betting and lay betting?
Yes. Although the HDAFU tables directly simulate what happened from a backing perspective over the last five seasons, they are obviously reversible and provide a sound benchmark for formulating lay betting strategies.
Large positive figures and rising curves within the tables indicate promising back betting opportunities, whilst large negative falling curves point to potential lay strategies.
The HDAFU tables come with an odds toggle as well as an exchange commission toggle so that the user can adjust the base figures where necessary – This is of great importance to those wishing to accurately analyse lay strategies.
Don’t forget that betting exchange odds are often ‘higher’ than the highest bookmaker odds and, of course, have a built-in commission surcharge levied by the exchange platform. The effects of these variables can be gauged using the toggle functions within each HDAFU table.
Further reading:
1×2 Betting System: Analysis of HDA Data and Strategy Development – LAY THE DRAW
1X2 Betting System – Staking the Underdog
Why is concentrating on bet types more profitable than betting on teams?
The answer to this question is simple psychology, which often defeats the average punter.
There are millions of people who follow one or another team. They read all the news available, discuss form, players and managers, and everything else there is to think about when a match involving “their” team is coming up.
There are plenty of “must win” situations, and even if the odds seem a little short, bets are still placed on the team they support to win the game. Both reliance on luck and a lot of hope goes into each game.
Unfortunately, gut feelings are very often a false friend and team news also has no relevance to the ‘true odds’ of a game; little wonder that there are more losing punters than winners.
The HDAFU tables help the gambler to disconnect all emotions from betting. The figures show very plainly where to concentrate when compiling a betting system portfolio for profit.
Further reading:
Finding Betting Odds Inflection Points
Half-time Results are more Predictable than Full-time
What do you recommend to read for better understanding of the HDAFU tables?
HDAFU Tables Knowledge Base
1X2 Betting System – Staking the Underdog
How to Compile a Winning Portfolio
Finding Betting Odds Inflection Points
Odds Toggle Function
HDA Betting: Profit/Loss Simulation Tables
PRODUCT SUMMARY
- Format: Excel .XLSX (compatible with Excel 2007 and higher, LibreOffice, Google Sheets, OpenOffice, etc.)
- File Size: between 623 KB and 2.85 MB each
- Publisher: Hertis Services Ltd (former Soccerwidow Ltd); 5th revised edition
- Simulations within each Workbook: Home Win, Draw, Away Win, Favourite & Underdog, plus a breakdown of individual teams’ performance in each bet type from both a home and away perspective.
- Language: ENGLISH
By purchasing this product you agree to our Terms and Conditions and Privacy Policy.
After payment you will be redirected to download your purchased product(s). You will also receive an e-mail with a confirmation of your purchase and download link from DPD (our partner for storing and delivering of digital products) as well as from PayPal (our partner for secure payment processing).
PayPal is an online payment service that is world-wide used for processing secure payments on the Internet. Paypal supports all major payment methods such as direct debit, credit cards and deposits. Should you wish another payment option then we also offer Neteller, Skrill (Moneybookers) or bank transfer. Check here.
Customer Comment
The results of your 2016-17 campaign are fantastic. I’m going to go through your campaign in detail and learn what I can about how and why you put it together and then hopefully go some way toward achieving what you guys did in that season.
One other thing I wanted to say about what you offer at Soccerwidow….the material – free and paid for – is so valuable and really does teach people what they need to know in order to understand the betting market and what is profitable and what is not, the pitfalls and the best way forward.
I’m very much like you in that I don’t see the value in blindly following someone else picks, but when someone doesn’t know the betting market or how to go about it themselves, blind following is what a lot of people gravitate towards.
With your products they really do teach people and empower them to be able to make their own decisions and do things the right way. I feel I have learned a tremendous amount since I found your website and am very much looking forward to putting it into practice in this upcoming football season.
Great job on what you guys do at Soccerwidow!
Simon


Hi Simon,
The system you have described is obviously very high risk as it involves potentially very few bets in a season.
In your overall portfolio, you’ll need a blend of low, medium and high risk systems running parallel with each other to support taking a risk on something like your Belgian example.
We would probably include only one such system in our portfolio, subject to it being a part of a minimum of 15 systems running concurrently. But personally, I would prefer something providing a minimum of perhaps 10-15 bets a season.
And, you really cannot afford to miss a single betting opportunity playing such small numbers.
At the end of the day, it’s all about personal taste and building a sound portfolio according to your acceptance of risk. Go with it as part of a well-balanced portfolio, but not in isolation.
Hope this helps.
Could I get your opinion on a system I found within the Belgian Whole season analysis please?
It’s relating to the AWAY WIN inflection graph. There is a point between odds of 8 to 8.35 where is a very sharp increase in the graph curve for a lot of profit.
On analysis of this I found the following:
Number of bets in 5 seasons: 21
Number of seasons in profit: 5
Profit: 5955
Hit Rate: 47.62
Win streak: 4
Losing streak: 3
Yield: 283%
The profit and yield figures seem extremely good for such a small number of bets, as well as the system being in profit for all 5 seasons. The actual yearly profits (most recent first) are: 500, 500, 2020, 1100 and 1835.
It seems on the face of it a very efficient use of resources to use a system like this.
In your opinion would a system with so few bets, most likely 4-5 in this upcoming season be a viable one to include in a portfolio?
Thanks.
Hi Right Winger,
are you going to publish results of winter 2016-2017 season leagues?
Hi Jo,
This is in the final throes of completion and will be published in the next 2-3 days…
Hey Right Winger,
any news on the release of the winter seasons results? I am really dying to see it!
Thanks!
Hi Daniel,
Yes, it’s all become a little hectic here, although I am hoping to finish and publish the article tomorrow.
But don’t worry, I can assure you and everyone else who is waiting in anticipation that it will be worth waiting for!
Hi Right Winger and Soccer Widow!
Just want to ask you, why do you compile France Ligue 2 tables along with all others? Didn’t you say that it’s best to use only first tier leagues for this type of betting strategy? What is so special about Ligue 2?
Thanks,
Daniel
Hi Daniel,
Good question.
Yes, France Ligue 2 is the only second tier league we consider including in any portfolio.
And yes, it is a special league and very different from any other lower league we have ever analysed in detail.
We include it because one bet type within Ligue 2 always stands head and shoulders above the rest. And the high frequency of the match result in question always reaps dividends.
I would say that all other lesser leagues (i.e. not top tier) tend to suffer from a lot of statistical noise due to the fact that the stability of the number of teams playing in the league is affected by teams leaving either by promotion or relegation.
Indeed, some of the lesser leagues have a 40% turnover of teams each season – in other words, potentially eight out of 20 teams will not be playing in that league the following season.
France Ligue 2 is no exception to the disruption caused by promotion and relegation. Only 35% of the 20 teams were ever-present in all five seasons 2012-17 (and also during 2011-16). This is pretty typical of a lower league, whereas with a premier league, this percentage is usually 60-70%, with only relegation affecting the number of clubs present.
With France Ligue 2, it doesn’t seem to matter what the make-up of the league is in terms of the teams represented in any single season, the results always remain remarkable.
It’s always the same bet type that makes money, whichever season you look at. I can’t tell you why this phenomenon exists in Ligue 2, but it is a peculiarity we regularly take advantage of.
I hope this helps!
Hi,
I was waiting for 2012-2016 summer tables to buy, regular chart didn’t and don’t show any updates, nor I got an e-mail notification about them available. i thought why it takes so long to wait since the new summer season is 7 just days away. Today, i opened basic version of the chart and found that 2012-2016 summer tables are available. Don’t forget to e-mail about new tables since the earlier you get them, the more time you have to analyse them.
Hi Jo, as far I’m aware you have been already in touch via email with Rob and purchased your tables. Thank you and all the best for the forthcoming season!
Strange: I do not see any tables for the 2016/17 seasons to buy as in the headline announced. Thanks for Information.
Hello Karsten – sorry, some issues with the site today, which are now resolved. Please refresh your screen or clear your cache to see the 2016-17 article and HDAFU tables.
Hi,
Do you know when we can expect the “Winter Leagues – Full time” tables updated for the 2015/2016 season to become available for purchase?
Best regards
John
Hi John, the updated HDA tables will be available 1-2 weeks before the new season starts.
hi
Im from South Africa and bookmakers from here give the English Championship nice odds. Is there anyway i can get Championship table
Hi Frank, we have not yet made a decision which tables to offer for the new season. However as the season doesn’t start before August, there’s plenty of time…
Hi,
Let me get this straight. If I buy a table, I look at the profitable odds, and the less profitable odds. I bet on the odds that tend to show a profit?
Kevin
Hi Kevin, in a nutshell, yes. But only in a nutshell. 🙂
You find the profitable odds clusters, and then develop a strategy out of this. However, it’s about system betting. This requires to take every round, not just a single game.
Hi Jo,
Wherever you select your odds from, the key is to be consistent. Get the home and away odds from the same sources.
Stick to one bookmaker if it’s easier for you, or pick the highest odds from a selection of bookmakers. But don’t mix the two approaches.
As you are always looking to place bets at the highest prices available to you, then it is probably better to choose all the bookmakers you have accounts with. This will provide you with a more realistic picture.
Of course, the fewer games you analyse, the more margin for statistical error there is. If you are analysing five seasons’ worth in any league, then choosing just one bookmaker will usually suffice. If it’s a smaller sample size, say just one season, then a bigger pool of available data would be better – i.e. data from several bookmakers.
I hope this helps and good luck!
let’s assume I want to back by Ratios: Backing the Favourite to win, using Away odds divided by Home odds cluster group. I’m not quite sure where do I need to take Home odds from? What I think is I take the highest odds for Away team available for me, and where do I take odds for Home team from? Is it the same bookmaker that gives the highest odds for Away team regardless are these odds the highest available for me or not?
Hello SW,
do you think a weighting of the different seasons seems to be useful?
For example multiply the P/L of the latest season with 1 and older ones with less than 1.
Regards Sören
Hi Sören, the HDAFU tables are simulations to show “what would have happened when…”, for example the bettor would have bet on Manchester Utd to win through a whole season, or 5 years. Or what would have happened if the bettor would only have bet on odds in the region of 1.8 to 2.5, and so on.
Weighting the different seasons doesn’t make sense for simulations of this kind.
Thank you for the explanation Soccerwidow.
I just thought maybe it would be good to weighting the seasons, because there are changes made over the last 5 seasons (manager, player changed,…) and so the latest seasons should be more dominant than a 5 year old one if I want to estimate the outcome for the next season?!
Hi Rajul,
Thanks for your valued custom and taking the trouble to provide feedback.
Yes, at first glance the HDAFU tables can be slightly overwhelming because they contain so much relevant information, but once you are able to sort the information in the data tab to filter out unprofitable segments of your preferred strategies then they do become very powerful indeed.
The half-time market is not so popular amongst punters and you can see this in the odds which bookmakers provide. Invariably, HT 1×2 odds carry a higher overround than the FT market. This is because the bookies take less money on HT markets and need to apply a larger margin in order to balance their book.
However, we do find great ‘value’ in the HT markets ourselves and many of the patterns in a lot of summer and winter leagues are more clear-cut than in the FT markets.
So far as recommending other tables, I can say for certain that every table contains something remarkable. You’ll see trends and patterns that simply cannot be seen in any other way. It is simply essential to combine historical odds with past results in order to see where the bookies make their money and, of course, where they are vulnerable.
Regarding your other query surrounding the HT 0-0 EPL market, I will email you privately.
Thanks again for your interest in Soccerwidow.
Dear SW,
Thank you for this powerful product. I’m finding it tricky to get to grips with it but making progress as I’m particularly keen to develop opportunities and methodologies in the HT market. Based on the English Premiership HT data, doesn’t it appear to make a clear case to do a blanket lay (all matches) of the HT 0-0 correct score, or am I being too simplistic in interpreting this?
Also, for my next purchase, would you advise buying the Premiership FT data or go for another HT data table and if so which one? I hope to eventually purchase all but for budget reasons at the moment would value your suggestion on the next logical purchase.
Kind regards,
Rajul
Hello Teng,
That is a very valid question and I am glad you have asked it.
The historical data we use is carefully sifted from Oddsportal. We take the 20 or so bookmakers they provide as their fixed pool, and then add from their optional bookmakers another 10 of the best to make a sample size of 30.
However, you must always bear in mind that with any of these odds data sites (including Betbrain), they obtain their figures by ‘scraping’ data from the bookmakers’ own websites. It is an impossible task to maintain up-to-the-second accuracy with every single bookmaker. Even an up-to-the-minute service is unlikely. Most of the time the odds you see will already be out of date by the time you visit the bookmaker website. Odds, especially on the more popular games, and particularly the closer you get to kick off, have a habit of changing quickly as the bookmaker balances his book.
At least with Oddsportal (which is the only site to our knowledge that does this), you can see the times when the historical odds were scraped. Often or not, you can also see from the overround details whether the average and highest odds are accurate, but more often than not there is always one or two odds that skew these results. For example, odds that have not updated since they opened and which then appear so out of kilter with the rest of the market that they are obviously wrong. These have to be taken out of the equation manually.
I have undertaken many manual exercises to check how quickly odds data sites stay in touch with the bookmakers’ sites by having many open at the same time and checking that the ante post odds showing in Oddsportal, Betbrain, etc., match them. You should not be surprised at how many occasions the figures do not match.
It is therefore an extremely painful exercise collecting accurate data – every match has to be scrutinised carefully and the errors taken out. You have to have a benchmark to make any kind of assumptions about the market. The close of ante post is the one we choose, and the highest odds at this point are the ones we take. Of course, even higher odds are often available at some point in the ante post market, so using the highest odds in our simulations is more of a mark of ‘average’ than using the average odds themselves.
The moral of this story is never to trust any website that provides an historical odds data service for free. They cannot possibly ensure it is accurate. It is always better to collect your own data – that which you have checked for accuracy and can rely on. Believe me, taking Oddsportal.com or football-data.co.uk odds data at face value and using them as the basis for your strategies is a recipe for disaster. There are even sites charging for data, which has never been checked for accuracy. “Caveat emptor” – let the buyer beware.
Always look at the overround figures for clues about the accuracy of historical stats. 1×2 FT results will invariably be 98-104%; 1×2 HT results will almost always be over 100% and up to as high as 108%. (These are benchmarks for the majority of games – the minority of games will be either side of these parameters).
With any mathematical calculation there is always a margin of error. As a guide, use whatever benchmark you set yourself and build in a margin of +/-5% to cope with data fluctuations. Remember, no statistical calculation is ever 100% accurate, which is why you can never win 100% of your bets.
A good question and thanks again for your attention to detail.