
From July 1st to August 26th we ran a Summer League HDAFU Tables Live Picks Trial to see if and how coronavirus lockdowns have affected match outcomes and betting results.
Towards the end of this summary article, we also discuss the statistical evidence of the lockdown effects as matches continue to be played without fans.
The Systems Employed
For the purposes of this test nine systems were selected across four leagues in close geographical proximity to one another.
Please note that it is normally our mandate when selecting systems for real-play portfolios only to pick the best single system in a league (e.g. whole-of-season or first half-season or second half-season), or best two systems (first half-season and second half-season).
However, for the purposes of this live simulation, we trialled a number of different first half-season systems from the four leagues. This was done because the choice of leagues in which to generate bets for this experiment was extremely limited at the time the simulation began.
Immediately below you will find screenshots taken from the actual 2020 Summer League HDAFU Tables showing each system in detail. The systems were determined after scrutinising the profit/loss curves shown in the dedicated ‘Inflection Points by HO/AO quotient’ tab in these tables. (Home Odds divided by Away Odds).
(Clicking on all of the images below enlarges them in a new tab):
FINLAND Veikkausliiga

Note that although the draw odds of these two systems overlap, it is important to understand that they apply to two separate tranches of games (i.e. the HO/AO quotients do not overlap). System (a) represents smaller quotients indicative of games involving short-priced home favourites. System (b) applies to quotients above 1 indicating games where the away team is the shorter-priced favourite. All nine of the systems in this simulation are non-overlapping to provide stand-alone comparisons.
ICELAND Úrvalsdeild

NORWAY Eliteserien

SWEDEN Allsvenskan

Results of the 2020 ‘Live’ HDAFU Tables Trial
Profit Loss Curve
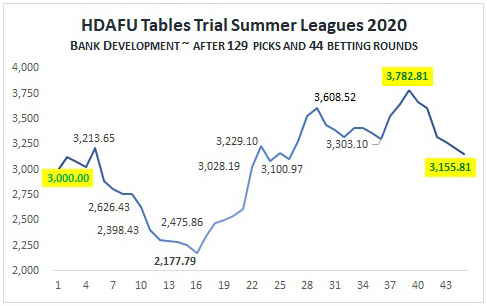
The graph below shows the final profit/loss curve after 44 rounds of betting (i.e. separate days) comprising a total of 129 bets:
 HDAFU Tables – Summer Leagues 2020 Live Simulation: Bank Development
If you were following our live picks on a daily basis you will remember that on August the 3rd, after 26 betting rounds (91 bets), we decided to cut two systems from the draft and monitor instead the results from the favourite win systems in Iceland and Sweden – both were underperforming badly and stood little or no chance of recovering into profit taking into consideration the likely number of remaining expected bets.
The 129 picks therefore included bets in both of these systems up to and including the 2nd of August but no further.
System-by-System Analysis
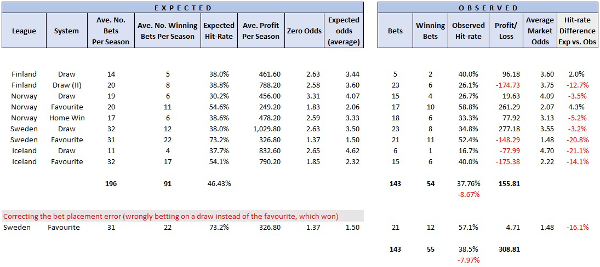
What do the results of this live picks simulation tell us?
In truth, not much, but it does prove that a profit can be made in a live environment from selecting systems based upon past-performance using the HDAFU Tables. As stated above we would never have chosen to play for real multiple first half-season systems in the same league – Always stick to the single best historical performer and construct portfolios based around these top performers in each of the leagues of your choice.
Although hindsight is a flexible tool, choosing just one system from each of the four leagues would have been relatively easy as the best four stood out markedly from the rest:
- FINLAND: Draw system at and between HO/AO quotients of 0.405 & 0.543. The corresponding draw odds between 3.39 and 3.60 were a less risky bet than the wider odds range of the other draw system. In other words, the system we would have played contained games that were more homogeneous (consistent) with each other.
- ICELAND: Draw system at and between HO/AO quotients of 0.152 & 0.33. The corresponding draw odds here were between 4.11 and 5.26. Again, it was considered to be a more consistent set of bets than the other system, which relied on choosing home or away favourites – literally two systems in one.
- NORWAY: Favourite system at and between HO/AO quotients of 0.445 & 0.67, corresponding to odds between 1.90 and 2.22. We would have picked this over the home win system option purely because the favourites were all going to be the home team anyway (HO/AO quotient below 1): the home win system option was more risky and wholly represented by underdogs at home. The historical profits shown in the analysis for the favourite were also more recent than those posted by the third option, the draw system.
- SWEDEN: Draw system at and between HO/AO quotients of 0.383 & 0.904 (corresponding draw odds 3.45 to 3.76). This was a far better set of historical data than betting on the favourite showed. Profits for the draw system were present in each of the previous five seasons and three times larger than those for the favourite system.
These four systems on their own (three winners and one loser) would have netted an overall profit of 556.66 units.
Coronavirus Effects on Home Performance
The four leagues chosen were all Nordic countries to provide some form of meaningful comparison.
(A) Two Leagues Resumed “as Normal”
Finland and Norway produced 1X2 results much in line with previous seasons but, in both leagues, the draw percentage was a little down and the away win was slightly up. But nothing statistically significant enough to say that playing with no crowds has affected the trends:
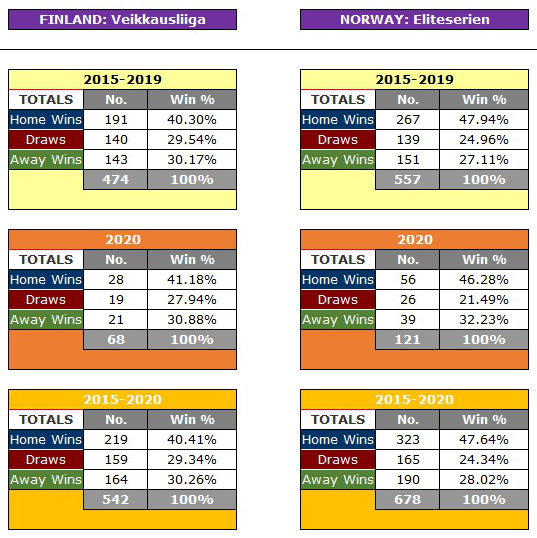 Finland & Norway: First Half-Season 1X2 Results Comparison
(B) Two Leagues with Notable Discrepancies
However, in Iceland and Sweden, the picture was different:
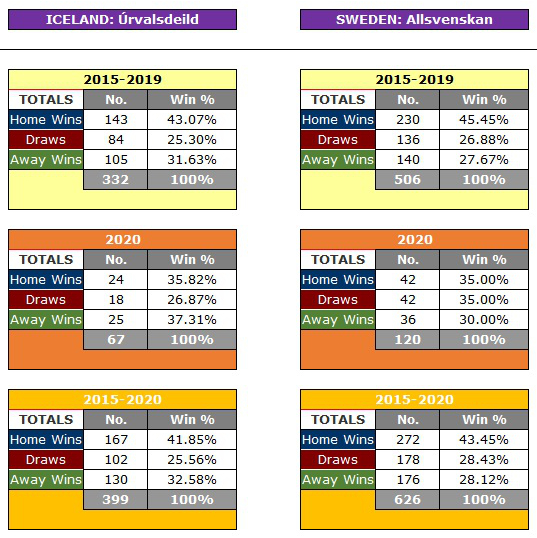 Iceland & Sweden: First Half-Season 1X2 Results Comparison
In both leagues, it is quite clear to see that home wins have dropped significantly, with draws and away wins increasing in frequency as a result.
Although it is too early to draw conclusions after just half a season, this is a situation that suggests monitoring and will perhaps be the subject of a follow-up article if trends continue in this manner.
Get the Analysis Spreadsheet!
If you would like the accompanying Excel spreadsheet (541Kb) for this article please click on the button below. It is priced at £9.99 and includes a host of useful formulas including the Excel logarithm formula to calculate the expected Longest Losing Streak once the expected hit-rate is known. Other analyses included:
- Full, country-by-country breakdown of each system and its performance
- First half-season Home, Draw and Away result comparison with previous five seasons
- Charts, graphs and tables representing the final results
- Template for identifying the bets, which can be tailored to your own requirements
- The usual array of Excel formulas for your own system selection purposes including monitoring
- …and much, much more!
HDAFU Table Discount Offer
In addition, you will receive a lifetime discount code with your product delivery note providing £35.00 off of any purchase of three or four HDAFU Tables (i.e. bridging the gap to the previous minimum five-table discount code). If you want a gentle introduction to the world of HDAFU Tables, or wish to target your leagues in smaller bundles, then this offer is for you!
Click here to get your Analysis Spreadsheet:
>>> 2020 HDAFU coronavirus test excel spreadsheet <<<
(Then click on the green Checkout button, fill in your name/email address details, submit your order and pay securely with PayPal or a credit card. A download link will then be sent to your email address. Check your junk mail if it doesn’t arrive in your inbox immediately).
Important Guidance on Picking Systems from a League
Despite choosing multiple systems from the four leagues for the purposes of the live test, our guidance for compiling a 1X2 portfolio from the HDAFU Tables remains unchanged: when selecting (i) a first half-season system and/or a second half-season system or (ii) a whole-of-season system, choose only one option from each league.
Choosing both a first half and second half-season system in the same league is completely viable (i.e. two systems in a single league), but don’t mix and match by implementing a whole-of-season system plus a first and/or second half system or multiples of any of these types in the same league:
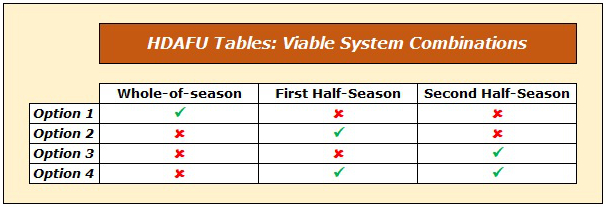 HDAFU Tables: Viable Combinations of Chosen Systems in Any One League – One Tick = One System


So how many units of profit if i put 1 euro fixed stake per match? please include this always in your tests, because it is much easier to compare with other strategies this way.
Hi Onur,
If you read the article again you will see that we used a fixed stake of 100 units for all of our calculations to make it easy for everyone to factor at whatever their preferred staking levels.
In your case, simply divide the figures shown by 100 to arrive at the results for 1 unit.
Thanks for taking the time and trouble to write to us and I hope this answers your question succinctly.