All of our 1×2 HDAFU simulation tables (Home-Draw-Away-Favourite-Underdog) are based on highest bookmaker odds at the close of the ante post betting market (i.e. match kick-off time, when the market switches to ‘in-play’).
All may seem well but how do you check for certain whether you are on track using the bookmaker and/or exchange odds you have access to?
Your Odds vs. Highest Odds
For precision betting our 1×2 simulations include a powerful adjustment tool enabling you to gauge whether or not your promising system on paper is performing in line with the historical data you based it upon.
We call it the Odds Toggle mechanism.
The Odds Toggle will help determine the potential of your chosen strategy or, indicate that it is doomed to fail at the level of odds you are buying (i.e. you are not achieving high enough odds on a consistent enough basis).
How to Calculate the Odds Toggle
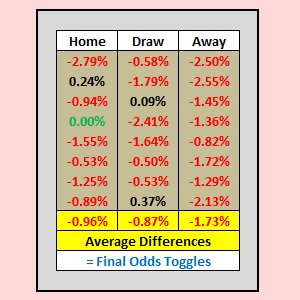
The example below shows the 1×2 odds toggle calculations for a single round of matches.
Click on the image below to enlarge it in a new tab:

Three Simple Steps to Calculate Odds Toggle Figures:
Step 1
The odds bought and the highest available in the market at the time are converted into percentages. In Excel this is a short, easy formula: =sum(1/odds) or =1/odds, with the result converted into a percentage.
Note: The three bold black positive figures in the three right-hand columns of the table above show where odds bought were higher than the eventual starting price but, overall in this example, the odds bought were mainly lower than the highest price available at kick-off (the negative differences shown in bold red).
Step 2
The percentages for the odds bought are deducted from the percentages for the highest market odds available.
Step 3
The differences are added together and then averaged to arrive at the final odds toggle figures.
Odds Monitoring is Essential for Reverse Engineering
The percentage difference between the best prices you achieve in the ante post period (with the bookmakers and exchanges in your portfolio) and the highest odds available at kick-off (in the market as a whole) can be used to ‘reverse engineer’ your simulation and view what effect the same experience would have had on the historical results.
Why is this so important?
- If you are regularly achieving better ante post prices than the highest on offer at kick-off, your odds toggle calculations will return more positive values. This will improve the outlook and long-term viability of your chosen betting system.
- Conversely, finding out how far adrift your odds are from the market at kick-off will determine whether it is worth continuing with a strategy or, whether to abort it and save valuable time and money.
- In both cases, you will have precise information available to formulate the most effective staking plan and take best advantage from the situation.
Note: You should use the archived odds and results section in www.oddsportal.com as the benchmark to find the highest bookmaker odds available at kick-off. Odds are updated in real time and the final pre-match odds are usually shown just a few minutes after kick-off.
Our article about Betting Systems Concepts describes how to set-up an Oddsportal account and include their entire complement of bookmakers in your display, whilst our article on Oddsportal Archived Odds helps you get accustomed to the layout of their site.
Precision Odds Monitoring
For precision monitoring you will need to recalculate the values applicable to your strategy after each betting round.
The final odds toggle figure you use should always be the accumulated averages of all the games up to that point, which you have paper tested or bet upon. Do not include any matches which formed part of your historical analysis.
If you are serious about betting then you will want to review your performance every step of the way. An odds monitoring feature like this is a necessary ingredient of any successful betting strategy.
Without it you will have no exact comparison between the system you have spent hours calculating and your real betting results (or paper tests). And believe me, with such small accumulating margins sometimes making huge differences to final results, attention to detail at this level is absolutely essential.


Hi Darren,
The problem with using one particular bookmaker’s odds is guaranteeing their accuracy in the first place.
Unless you sit and record the odds manually for every game in a league at the point in time you plan to bet in the future, there simply is no reliable source of historical odds.
Oddsportal, Football-data and Football-bet-data are the only three sites we know of that produce historical odds. They can only scrape these odds from bookmaker sites using an API.
Of course, the bookmakers do all they can not to make it easy to collect data in this fashion.
Let’s look at Oddsportal for example. Just hover over the final odds showing in Oddsportal and you will see a time stamp for when those odds were collected.
If you’ve used Oddsportal as often as we have you will begin to notice that odds posted as the highest for a particular bet type are all over the place. Sometimes, they are spot on – either on the time of kick-off or a minute or two beforehand. These are ideal.
Some highest odds are the opening odds of a particular bookmaker, which hasn’t responded to the API requests since.
Others are responses to API requests AFTER kick-off time, in other words, showing in-play odds.
What we need are reliable odds at one point in time, so all odds have to be checked and audited before we use them.
Just have a look at the average odds in Oddsportal. They are neither ‘average’ (useless anyway) nor ‘harmonic mean’ odds. We have no idea how they calculate these ‘averages’ or what they are intended for. They are certainly not the average of all the odds in the list, or the harmonic mean of the same.
Regarding your exercise with the HDAFU table, unless you know the procedure for entering data in order to produce the graphs and know the formulas to use in the Inflection Points Tab, then the results you will receive will definitely be wildly inaccurate and unusable.
Sorry, but compiling the tables is our trade secret! 🙂
Hi, Fantastic site which I am slowly making my way through.
I recently bought the English Premier League HDAFU table and have been playing around with it. I haven’t yet begun to calculate the odds toggle but I was curious as to what happen if i replaced the best bookmakers odds with those of a single particular bookmaker (my main bookmaker account) – with the perhaps erroneous assumption that by using the historical odds of a particular bookie a strategy and forecast could be developed when placing bets with that bookie.
I used the football data websites historical data and copied and pasted both the match results and the odds for the particular bookie. The results were startling and the inflection graphs bore no resemblance whatsoever to those in the original tables. I was expecting to see some changes but thought that overall the graphs would look reasonably the same.
Does this mean that if I used the original tables to develop a betting strategy and applied it to that bookmaker then I would be in for a shock and a loss?
Have I not taken into account some hidden variables in the tables themselves – Data columns A-G for example?
Am I missing an important concept in my understanding perhaps?
Hi there,
i don’t understand why for your analysis you use the maximum available odds on the market instead of the average.
Correct me if i’m wrong, but if i use the average figure (as reported by Oddsportal or BetBrain or whatever) most of the times i don’t have to worry about finding prices lower than that particular one, and in most cases i will buy an even higher price, boosting my expected profit on that particular event. I bet through a brokering service for limiting the quantity of accounts i have to keep funded, so i have access to a limited quantity of bookies and can not select always the best price available on the market. I can often beat the average though with the selected bookies i have at my disposal. Is there something wrong in using this type of analysis compared to yours?
I’m looking forward to hear from you.
Thanks!
Daniele
I just found your article explaining in detail why to consider higher odds instead of average odds. As always, great job! This website is a must for study and understanding of profitable betting strategies. Thanks for all your hard work, really!
Daniele
Daniele,
Thanks for the kind words – You are more than welcome!