
Value betting is a phrase used to describe an approach to gambling for long term profit. Although this term is widely employed in the sports betting world, unfortunately neither ‘value’ nor ‘value betting’ are anywhere clearly defined, which naturally leads to misunderstanding and confusion.
When people talk about ‘value’ in connection with betting there are many different schools of thought.
This article therefore attempts to shed some light on this complex concept and its terminology…
Firstly, let us begin with a few synonyms for the word ‘value’: worth; usefulness; advantage; benefit; gain; profit; amount; rate; price…
You can see straight away that there is a plethora of different connotations.
The last two meanings in particular, ‘rate’ and ‘price’, are probably the reason why the expression ‘value’, when used in the context of ‘value betting’ is often unclear.
So, what is Value in relation to Sports Betting?
In order to really understand the concept of ‘value betting’, you need to grasp several connected aspects and I will tackle each of these individually for better comprehension.
Tip: Grab yourself a caffeine shot and read every section (re-read if necessary) until you are comfortable enough to proceed to the next. What I am about to say may initially be hard for some to digest, but don’t worry, you will certainly not be alone. Headache pills may be advisable for some… 😉
(1) Betting Odds are solely the Market Prices for Bets
Anyone interested in sports betting knows that bookmakers offer bets on a multitude of match outcomes and sometimes the list of available bets on a single event can appear endless.
For example, the 1×2 market allows you to bet on a home win, a draw, or an away win, either at half- or full-time. Will there be more than two goals in the match or not (over or under 2.5 goals), will both teams score, or will the match end goal-less? Et cetera, et cetera…
Only very few bettors fully comprehend and understand the fact that betting odds are nothing more than the market prices of bets.
Betting Odds are Prices that Few Understand
Betting odds are not only all-inclusive prices for bets but to add to the confusion they are displayed, not in simple and easy understandable monetary units, but in different formats such as decimals, fractions, or moneyline.
When buying a bottle of beer, for example, you pay one Euro, Pound or Dollar and walk home with your purchase. When buying a bet, say, at decimal odds of 1.27 (27/100 Fractional Odds; -370 U.S. Money Line), the only thing you may understand is that if the bet wins you will receive your stake money back plus 27% winnings. Of course, if the bet loses all of the stake money is forfeited.
Judging ‘value for money’ from a bottle of beer is far easier than evaluating the same in a bet. Many bettors struggle to calculate the expected return of a bet or a series of bets let alone analyse why the big win they hoped for failed to materialise.
Even if sports betting odds appear to be genuine offers, the fact is that odds are frequently distorted.
Betting Odds cannot be priced by Gut Feeling or Intuition
Very few people are born with a sense of probabilities and ratios. Statistics and financial education are rarely taught in high school and touched upon in very few university courses.
To develop a ‘feeling for price’ is impossible, even for those of us who are born with a sense of probabilities.
To make matters worse, every bet is actually a different product, even if betting on just one particular type, for example, the “over 1.5 goals” market. Think about this bet in the context of a match between two evenly matched teams as opposed to, say, the team at the top of the table playing the weakest team in the league. The name of the bet is still the same but the two match situations are totally different.
There is no way but applying maths and statistics to decide whether the price of any bet offered is “too expensive” or “too cheap”. Gut feeling is misleading and may prove fatal. Probabilities are a subject too complex to succeed with guesswork, feeling and intuition alone.
For those of you who are really serious about understanding sports betting in depth and developing a value betting strategy, there really is no alternative to learning the calculations necessary.
In order to grasp the concept of value it is of uttermost importance to comprehend that betting odds are merely prices, and not ‘true odds’.
Before I address the term ‘value’ I must first plunge into probabilities… please stay afloat!
(2) The Broken Connection between Probabilities and Betting Odds
Once you have grasped that betting odds are nothing more than the price of a bet it should now be apparent that market odds cannot possibly “represent” the true probability (likelihood) of an outcome.
 Image: Dragana Gerasimoski (Shutterstock)
It should be obvious that “making a book” is the business of bookmakers and they must ensure that the advantage is on their side. Common sense dictates that betting odds (price) can have little to do with true probabilities.
You must understand that bookmakers have no option but to manipulate odds in order to balance their books. They also construct odds to match public opinion, and use odds as a marketing tool to attract customers.
It is absolutely correct that betting odds can be converted into their implied probabilities. However, these probabilities seldom represent the actual ‘real’ chance that a particular outcome will occur. Though, the implied probabilities are very important for identifying ‘value’.
To reiterate: Betting odds are the prices of bets, not their probabilities!
Here, at this point, the huge advantage bookmakers hold over the uninitiated comes into focus:
- How many people do you know personally who were born with a good sense and acute awareness of probabilities?
- Do you actually know anyone who can demonstrate a sound training or exhibit a qualification in statistics and probability?
- Is this rare person actually interested in sports betting?
On the other hand, how many people do you know who collect money-off coupons, or chase after shopping discounts at summer or winter sales?
Do you wholeheartedly think that these people truly acquire decent quality with each bargain they come home with?
Or maybe they are tempted by these opportunities to spend more money than they actually had in their household budget, and may end up with a lot of things they didn’t really need, but which were “soooooo cheap” at the time? 😈
I shall not delve any further into the mindsets of bettors or shoppers but I hope the analogy makes sense.
So, to summarise what I have discussed so far:
- Betting odds are the price of a bet.
- Betting odds can be converted into implied probabilities but these have hardly anything to do with the actual expected distribution of results.
Forgive me for preaching, but these are two vital elements you must fully internalise in order to have a chance of understanding the concept of value betting.
Now we finally get to the term ‘value’ of a bet… (And about time too, Soccerwidow!) 🙄
(3) The Term ‘Value’ in Relation to Sports Betting
When professionals speak of the ‘value’ of a bet, they are referring neither to the price of a bet (betting odds), nor to the probability of winning the particular bet. Value does not even mean betting odds for a particular bet being “too high” or “too low”.
The term ‘Value’ is used when a positive return can be expected. It is about the intrinsic value of a betting decision.
Please note that although this may be contradictory to common (non-entrepreneurial) sense, a purchase may hold ‘intrinsic value’ even if computations return a negative figure.
To compute value, formulas for the calculation of Profitability can be used.
It is possible to calculate the ‘mathematical advantage’ (value of a bet). The result is (nothing more than) a mathematical expression and technical declaration. The computed value estimates the expected return on investment. This information can then be used as guidance for betting decisions.
There are two different ‘Values’:
- Value I: Mathematical advantage of a bet. (Expected return = profitability)
This ratio indicates if the offered price in the market seems too low or too high. It also computes how much investment increase can be expected if the same transaction (bet) is repeated over and over again. - Value II: Relative deviation, being the ratio of the implied probability (market odds) relative to the mathematical probability expectation (true odds).
This ‘value’ is used for further evaluation and statistical computations; for example, it is very helpful for correlation analysis, cluster grouping and portfolio construction.
Now comes the fun… Caution! It’s getting mathematical! ❗
(4) How to Calculate Value?
Value is the “mathematical advantage” (expected return/ profitability) of a bet in relation to the investment.
 Value Betting: Market odds vs. True odds
Value computation (profitability and relative deviation)
The investment is the risk (loss) which is hazarded when buying a bet.
Value is calculated from the price of a bet (market betting odds) computed in relation to the ‘true’ betting odds (calculated based on the actual expected probability of occurrence).
Example of an over 1.5 goals bet:
Betting odds in the market: 1.27 (78.7%)
True betting odds (own computation): 1.23 (81.3%)
(1.27 -1) / (1.23 -1) -1 = 17.4%
The above result (17.4%) is Value I (= expected profitability), in this example, from a back bet on over 1.5 goals.
If one gambles 100 times an amount of 10 units on the above odds (1.27), one expects that 81.3% (own calculated probability) of the placed bets will win. The formula is:-
Net Return [European market odds minus 1] x Expected Hit Rate [own computed probability]
100 × 10 × 0.27 × 81.3% = 219.51 units
It is expected that the remaining 18.7% (100% minus 81.3%) of the bets will lose:
Thus, the expected profit from this repeat transaction is 32.72 units (219.51 minus 186.99).
The overall risk [investment] of the bet is 186.99 units (the total of losing bets).
As 81.3% of the bets will win, 81.3% of the stakes will be returned (not lost). These bets do not count as ‘investment’.
Dividing the expected profit (32.72 units) by the investment (186.99 units) equals 17.4%. This is the ‘value’ of this particular bet in the example (= expected cash flow from the investment).
Both of the above calculation methods lead to the same result: 17.4% -> Value I: mathematical advantage (expected profitability).
The above example is taken from my Over / Under ‘X’ Goals course where I explain in detail betting odds calculation using the example of the over/under market as well as value computations and their interpretation.
The course includes many sample calculations, an introduction to cluster grouping, a multitude of formulas (for backing as well as laying), examples aplenty, and exercises at the end of each section for you to perform in order to hone your skills. (Answers are provided at the end of the course).
Knowledge of betting odds calculation and value computation is a MUST for people who seriously want to make money with sports betting.
(5) Computing Value is the First Step for Value Betting
 Image: Sergey Nivens (Shutterstock)
Computing value and how much of it is contained in a bet is only the first step.
At this point, it is important to note that ‘value’ is just a mathematically computed metric. (Formulas to calculate the “mathematical advantage” (profitability) are explained on the previous page). Sure, computing ‘value’ supplies a great parameter, but it is not the finishing line when it comes to ‘value betting’.
The trap that many bettors fall into having understood the ‘value of a bet’ up to this point is that they now bet on everything where a positive value is shown. This is NOT value betting!
Because “taking it all” will usually result in a rather nasty backfire. (Just remember the example earlier about bargain hunters and the observation that they do not necessarily buy what they actually need).
I digress now with an illustration from stock market analysis:
To calculate the value of a share, financial analysts often use methods referred to as “technical analysis”. This means calculating the expected price of a share using publicly available financial information about the companies. They compute their own estimations of expected share prices and compare them to the current market price of a stock. This assesses whether a stock is undervalued or overvalued. However, it is well known that two analysts may well come up with two totally different results. 😀 😥
Furthermore, markets have a nasty habit of taking unexpected turns. Companies, although often quite large in structure, are not well-oiled machines. Even if one can assume that large, well-functioning systems change only very slowly, there are a lot of factors that can cause a sudden reversal. For example, new technology may quickly make a firm’s or an entire industry’s products redundant, or even more fundamentally, an environmental disaster such as an earthquake or tsunami strikes destabilising local currencies. There is a plethora of unpredictable factors.
Based solely on technical computations, automating an equity share portfolio is simply not possible… and unfortunately, this also applies to betting.
I often receive enquiries about automating my Excel calculation spreadsheet: True Odds & Value Detector: League Games with H2H History not only to compute the true odds (expectated probabilities) as well as both ‘values’ (Value I: mathematical advantage and Value II: relative deviation), but also to highlight pick selections automatically.
Unfortunately, this is asking for the impossible. I cannot cater for every individual’s preferred betting system or portfolio. The True Odds & Value Detector therefore masters and performs a specific function and is not a ‘jack of all trades’ solution.
(6) Second Step of Value Betting: Assessing and Evaluating
It is important to bear in mind that both computed values (Value I: mathematical advantage and Value II: relative deviation) are only the results of formulas.
Of course, these metrics play a big role in disconnecting emotions from betting decisions. Foremostly, they promote controlled and rational decisions ahead of a gut feeling. The computations also provide measurements to allow comparisons to be made between different teams within a league, no matter which league is chosen.
However, even after these mathematical values have been computed (a very important step in itself) one must continue with “assessing and evaluating“.
I shall return to my beer theme as an example:
Imagine you are not a beer drinker yourself and you are expecting guests. They have asked you to get some beer, ideally stout, but they were not specific as to what you should do if you couldn’t find any in the shops. From your neighbour, you know that the price for a tin (440ml) should be in the region of £0.80. So, armed with £20, you pop out to your local shop expecting to get four six-packs.
Unfortunately, when you arrive, there is no stout. The shop only has lager, real ale and bitter, all in one-litre bottles. The prices are £1.20 for a lager, £2.50 for the real ale, and £2.00 for the bitter.
You need to make a decision.
Of course, you can now take out your calculator and start computing some figures. One litre of stout would have cost you £1.82. The closest to this price is bitter, but as you are not a beer drinker you are unsure if bitter is an acceptable replacement for stout.
Lager, you calculate, is 34% cheaper than one litre of stout; ale is 37.5% more expensive. Does this really mean that ale is a much better buy, and should you go for it?
You start comparing the alcohol content. You look at the bottles but cannot decide which the best solution is. You may even talk to the shop assistant or other customers to get a second opinion.
What I am trying to say is that in this (like in many other) ‘normal’ life scenarios you are trying your hardest to get the best ‘value for money’ to fill a need. You not only have to compare prices, bottle sizes and alcohol content, you must “assess and evaluate” all the information available before you can make an informed and balanced decision.
(7) Value Betting in Practice – Making Informed Decisions
 Image: Kristo-Gothard Hunor (Shutterstock)
What you have learned so far:
Betting odds are the price of a bet.
Betting odds can be converted into implied probabilities but these have little to do with the actual expected distribution of results.
There are two different ‘Values’:
(A) Value I: Mathematical advantage of a bet. (Expected return = profitability)
This ratio indicates if the offered price in the market seems too low or too high. It also computes how much investment increase can be expected if the same transaction (bet) is repeated over and over again.
(B) Value II: Relative deviation from the market odds, being the ratio of the mathematical probability expectation (true odds) relative to the implied probability (market odds).
This ‘value’ is used for further evaluation and statistical computations.
True Odds & Value Detector Example
The screenshot below (click to open a larger version in a new tab) is taken from our Value Bet Detector and this portion of the spreadsheet displays calculations for the “under ‘X’ goals” market in the match between Manchester United and Liverpool played on 16th March, 2014.
You can see that although ‘Under 1.5 goals’ had a positive value the spreadsheet did not flag it up as bet recommendation. It only flagged up the ‘Under 3.5 goals bet’ which had a 70.67% chance to win.
This is one of our personal selection criteria when choosing bets. We do not include bets in our portfolio with less than 70% chance of winning.
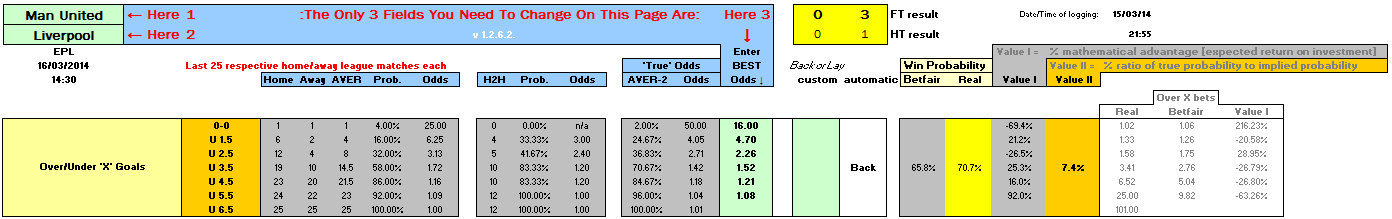 16.03.2014: Manchester United vs Liverpool – Under goals calculation
Soccerwidow’s True Odds Calculator and Value detector
First: Compute ‘Value’
Second: Assess and Evaluate
Last: Construct Portfolio » » » » » VALUE BETTING
Computing ‘Value’ is a mechanical job like comparing the prices of stout, lager, ale and bitter. After ‘value’ has been calculated by our spreadsheet the brain needs to kick in, because there is no statistical analysis in this world, no formula, no super-computer, which is able to replace the human capabilities of reason and logic.
It happens often enough that our spreadsheet flags up a potential bet, but we do NOT include it in the betting portfolio. Using judgment to assess a set of automatic calculations in a spreadsheet helped us publish a whole set of successful picks for the Euro 2012 tournament, with 48.17% growth of our betting bank in just one month: Soccerwidow’s Value Betting Results: 274 Bets, from 07/12/2011 to 30/06/2012.
I cannot stress enough the importance of assessing and evaluating value computations. Do not underestimate the significance of your own thinking. It would be too good to be true if it were possible to compute the value of a potential partner, then blindly marry that person and live happily thereafter.
Although a bet’s “mathematical advantage” or “expected profit” can be calculated, there is no guarantee that things will develop in the future as computed from historical statistics. Statistics and probabilities are about chances, not certainties.
Once you have understood the concept of value this far, the story is not over yet. In order to win, you have to get your head around cluster group formation as well portfolio construction for risk diversification.
Here, the bookies again have the edge: They sell bets applicable to hundreds of soccer teams per day involving dozens of different leagues and competitions. Indeed, their portfolio comprises tens if not hundreds of thousands of ante-post and in-play bets on a whole variety of sports on a daily basis, which even the most ardent of gamblers, can never hope to match.
I hope very much that I have shed some light on this subject and that the terms ‘value’ and ‘value betting’ in relation to sports betting are now a little clearer.
‘Value Betting’ means:
Firstly, compute value;
Secondly, assess and evaluate the computations to be able to judge the intrinsic value of a bet.
Then, if the bet actually fits into your portfolio parameters at the end of this process, a concrete betting decision can be made.
I Wish You all the best with your Betting Endeavours
I have given it my best shot to try and explain the way of thinking behind the concept of ‘value’. Now it’s up to you to understand the information and make the most of it.
There are probably many of you who have stuck with this article and seen it through to the end, no matter how painful the journey has been. Still, I must stress that the illustration of value and how to calculate it is a highly simplified example.
If you’d like to learn more and dive deeper into the subject, then think seriously about purchasing my Over / Under X Goals course. The course is designed to educate and guide the reader through a learning experience to achieve understanding.
You may even consider purchasing the True Odds & Value Detector: League Games with H2H History but please be aware that none of the products is an automated betting tool. They provide vital statistical and mathematical information to help you understand percentages, odds calculation and value betting, but these data are not a substitute for your own judgment.
If you enjoyed this article, you may also be interested in the following complimentary articles on the subject of odds calculation:
How is Overround Calculated and what are the Benefits of Removing it from the Betting Odds?
How do Bookmakers Tick? How & Why do they Set Their Odds as they do?
How Bookmakers’ Odds Match Public Opinion
Probability, Expectation, Hit Rate, Value, Mathematical Advantage: Explained
1×2 Betting System: Analysis of HDA Data and Strategy Development – LAY THE DRAW


Hi Soccerwidow,
thanks a lot for your articles.
I think I found a small error in the alternative calculation method on page 3.
It says: 100 × 10 × 0.23 × 81.3% = 219.51 units
Correct would be 0.27 instead of 0.23. The result stays the same.
Daniel
Hi Daniel,
Many thanks for taking the trouble to point out the typing error, which has now been corrected.
Your support is greatly appreciated,
Soccerwidow 🙂
Hi Soccerwidow! Thank for your site. How find value in correct score market? Can we apply this article to correct score market? Thanks
just, Thank You!
I do need to read again.. and probably again and again and again, but this is the first thing ever that makes even a starter amount of sense (I am a bookie offer taker) but never believed all offers were “long term” value
will you be resuming your tips ( value bets ) like you produced for Betfair , always found them very good
TC1 – Thanks for the praise (blush!). Sadly we have no plans at present to re-start a value betting tipping service. Firstly, it was very time-consuming and secondly, very difficult to maintain an ethical approach against a backdrop of clients who praised when things went well, and those who criticised when things didn’t work out for them in the short-run.
Value betting is a long-term strategy but no matter how many times we point this out to people, they still get tense and agitated when the inevitable losing streaks occur. We don’t wish to martyr ourselves again, so producing picks is not on the agenda at this time.
Sorry to disappoint and thanks for all your past and valued contributions to Soccerwidow.
Dear soccerwidow
The above shows how a back bet value edge is counted.
I can’t seems to understand the way you count a lay bet value
Do you mind showing me how?
Hi TechChuan,
to calculate the ‘value’ for a lay bet you have simply to reverse the calculations.
Just repeat the calculations as shown on page #3, and reverse the odds. Assume that the implied probability was 81.3% (market odds 1.23), and the true odds 78.7% (1.27).
thank you very much. Ill look more into it.
Where can I find total goal odds calculation in your web? Ive been looking into every article of yours but I can’t find any info regarding total goal calculation
You will actually only find one article regarding total goal distribution on the website: Goal Distribution Comparison – EPL, Bundesliga, Ligue 1, Eredivisie
The problem is that writing articles like this not only takes a few days of writing time, but also requires hundreds of working hours of research and calculations.
I’m sorry, but it is impossible to provide substantial work for free. Therefore, for those interested into goal calculation there is a (paid) course available: Football Betting Odds Calculation Course – How to Calculate Odds – Over / Under ‘X’ Goals
Dear soccer widow
May I ask which parameter do you weight more before deciding to bet, value or hit rate?
Your site has the most complete knowledge of value bets and probability that i can find.
I have spent many days reading through all your articles. Still a lot to learn from you all.
Thank you so much for your great effort.
TeckChuan
I’m risk avers, so for me, the hit rate is more important.
We have a nice saying in German: Kleinvieh macht auch Mist
The literal translation is: Flock makes also muck. The meaning is that even small amounts add up to big piles. It’s about steadiness.
I think the English proverb equivalent is: Many a little makes a mickle.
Dear soccerwidow
How about the hit rate of a lay bet ?
Say Wales has a true odd of 8.33 to win, market odds is 6.2
So lay bet value is 34% and hit rate of Wales not winning is 88%?
Thanks a lot
Correct!
The lay bet value is 34.35%, and the expected hit rate of Wales not winning 88%.
By the way, the value here calculated is the expected Yield if bets like this are carried out over and over again.
Hi,
In your spreadsheet for U 3,5 goals you have a Value 1 = 25,3%, how did you calculate this?
I tried with your method from page 3: (0,52 / 0,42) – 1 = 23,8%
Thanks.
Hi Pettersen,
the odds (1.42) shown in the spreadsheet originate from 70.67% converted into odds = 1.415028, and then rounded to 1.42 to be shown in the spreadsheet.
The calculation is based on the 1.415028. Please try again, and you will see that it results in 25.3%.
Remember as a general rule always to calculate with percentages, and not with odds.
I have to disagree with you when you say that ‘Betting odds can be converted into implied probabilities but these have little to do with the actual expected distribution of results’. Depending on the market you choose, betting odds are a much better indicator of an event outcome than any other method out there. Given that the chosen bookmaker has enough transctions on a single event, the prediction extracted from odds probabilities are most accurate. The ‘wisdom of the crowd’ is not just a theory it’s a fact and many studies have oroven that.
Hi Max, if bookmakers would always price their odds ‘true’ then they couldn’t stay in business and grow. They have to underprice the most likely outcomes and ensure that the mathematical advantage is always on their side. They utilise the ‘wisdom of the crowd’ to their advantage.
Here are a few articles which explain this enigma a little bit more in detail:
How Bookmakers’ Odds Match Public Opinion
5 Simple Steps to Win Over and Under Betting
Finding Betting Odds Inflection Points – Bet and Win
Hi Soccerwidow
I get what you are saying, but what do you think about articles like this?
According to the efficient market hypothesis, the closing odds provide the most efficient or most accurate representation of the probabilities of actual results, since they reflect the most amount of information expressed in the form of wagers by the betting public.
[…..]
Given the strength of the correlation and its almost perfect 1:1 relationship between expected and observed yields (Football-data.co.uk)
or this one
Through looking at the correlation between the expected probability of a game’s outcome and the actual outcome it is possible to determine how accurate a bookmaker’s odds are. From a sample size of 397,935 football games offered by Pinnacle Sports, a sharp bookmaker, there existed a high correlation (r-squared = 0.997) between the closing lines and the observed probabilities. In other words, Pinnacle’s odds accurately predicted the real world outcome 99.7% of the time. Meaning that that their odds are very efficient. (blog.tradematesports.com)
The football-data.co.uk article is about the accurancy of the expected Yield, not about the accuracy of odds…
For example, if he bet a team at a price of 2.50 which subsequently closed at 2.00, his expected value would be 2.50/2.00 or 25%. This expected value would thus be equivalent to his expected yield over a larger sample of wagers.
The other article from blog.tradematesports.com is a very long article, and what I can see on the first glance it’s mainly targeted at traders… It’s mainly about that trades close to kick-off reduces the likelihood that the edge will change dramatically.
I agree with the statement that The closing line in high liquidity markets reflects the true odds, because it incorporates all of the information that exists in the market, but there is also the statement Lower liquidity markets are much more volatile and thus riskier than high liquidity markets..
As already said, this article is targeting traders and these people are mainly interested into high liquidity markets, but Soccerwidow is targeting punters and value bettors, and therefore I stick to my statement that Bookmakers’ Odds Match Public Opinion if they can make use of the ‘wisdom of the crowd’, or in other words, of the ‘gut feelings’ of the bettors.
And isn’t than more effective to use the closing line from high liquidity markets against the small bookmakers who are not able to update their odds in real time. In my opinion this is where we can find real value odds. At least it worked for me for many years. I find it useless to chase all sorts of fantasy stats when you have such a good indicator of a game outcome. At least this is my opinion.
Hello, have you ever thought about taking in consideration recent Games and their Results of both Teams against common opponents? You can find this information on sites like fussball.wettpoint.com . For example
Team Avellino won 30 % of the Games against common opponents (with 30 % Draws)
and the Team Frosinone won up to today 45 % of these Games (45 % Draw). Adding this stats to the final real odds.
In this particular game the “real odds” according to the spreadsheet are 37.5% 27.1% 35.4% but we can use also the stats from above and make an average of real odds.
So now the real odds should look like this 33.8% 36% and 30.2% for the draw. I hope you understand me my english is not my first language.
Hi Manu,
if you want to take into consideration recent games then you can only use games against equally strong opponents (find the stats for the last 6 games by HO/AO quotient).
Next, calculate the observed distributions for the 5 previous seasons; without any games of the current season (again, for the HO/AO quotient of the match analysed) That is the ‘expectation’ (expectancy value) for the current season.
Last, take into consideration the phenomenon: Regression toward the Mean. This statistical phenomenon means that if a variable is extreme on its first measurement, it will tend to be closer to the average on its second measurement—and if it is extreme on its second measurement, it will tend to have been closer to the average on its first.
Very simplified example:
Please keep in mind that 1×2 calculations are unfortunately not as straightforward as the above example (e.g. you also have to take goal differences into consideration) but something along these lines.
Hope that helps you to think in the right direction.
Best wishes,
Soccerwidow