From 1st July until 2nd August 2020, we carried out a public experiment to showcase Over/Under ‘X’ goals picks based on the teachings of our Over/Under Odds Calculation coursebook.
The experiment was prompted by the outbreak of the coronavirus and the fact that many leagues suspended their games for a period of a few months and afterwards resumed in empty stadiums. We wanted to see whether historical statistics could still be used and what could be observed after this unexpectedly long break.
The General Outcome of 25 Betting Rounds and 77 Bets
The bank grew from an initial figure of 3,000.00 units to an impressive total of 4,617.56 using ratcheted stakes during the course of just one month.
It was very pleasing to see that the Cluster Tables performed so reliably well despite the coronavirus outbreak and the consequent very long pauses in our featured leagues:
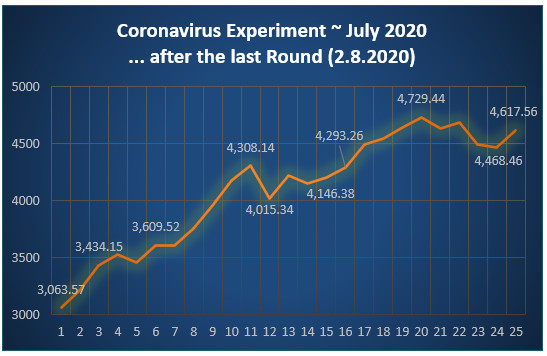 Table 1: Corona experiment July-August 2020
Profit/Loss graph after 25 rounds
During this 33-day period a total of 77 bets were placed within the 60% to 80% probability range.
Here’s the distribution of those bets and the Profit/Loss achieved split into clusters of 2% probability increments:
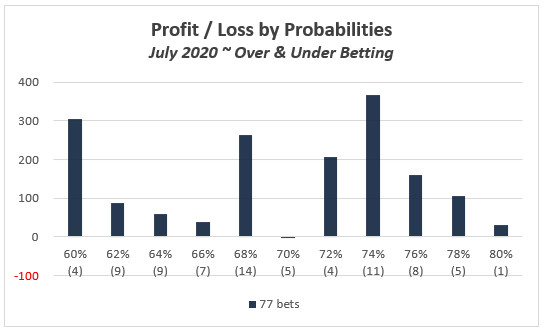 Table 2: July-August 2020 – Over/Under experiment P/L results graph by Probability
From the above chart, you can see that all but one of these clusters produced a profit. However, the number of bets varied in each cluster. For example, there were four bets with a probability between 60% and 62%, and nine bets in the 62% to 64% cluster, and so on.
77 bets is a very small sample size and this becomes even smaller when trying to form conclusions about each of the 2% clusters. However, this is a practical way of maintaining control if you are using the Cluster Tables for your own betting.
Indeed, for monitoring purposes, we recommend that you do sort your bets in small probability clusters and judge the synergy of your portfolio on the basis of its entire performance. You will find it easier to make decisions if there are obvious areas that are letting down the results.
How the Bets were Chosen
The bets were chosen using our Cluster Table tools that are the product of our coursebook teachings. With these tables, you can very quickly determine the expected probabilities of Over/Under bets for any forthcoming match involving the featured teams (i.e. only those playing in at least their sixth consecutive season in that league – identified in the tables).
To help explain how the bets were chosen, here’s an example using the very last pick of our experiment:
Sassuolo vs. Udinese on 02/08/2020
Below is an extract from the Cluster Table used to make this pick:
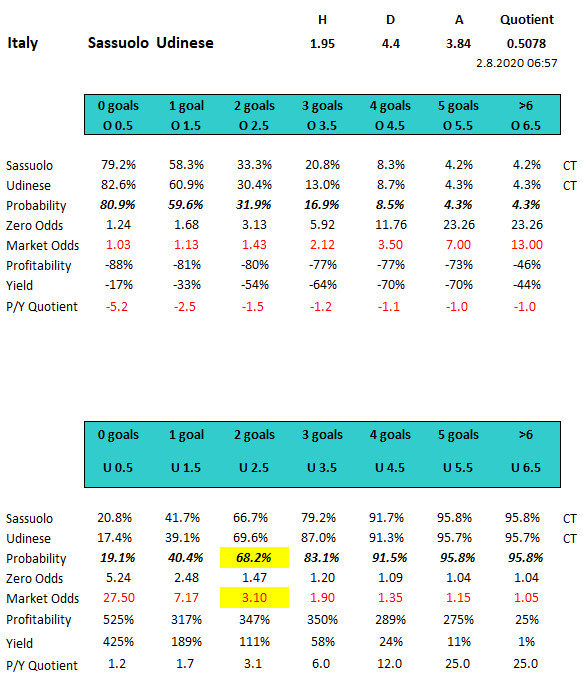 Table 3: Calculating the Over/Under bets
Sassuolo vs. Udinese 02/08/2020
Sassuolo was the favourite to win the game at odds of 1.95; Udinese was the underdog at odds of 3.84 (odds taken at 06:57 GMT+1 on the day of the match).
With these odds, the HO/AO quotient was calculated:
Home Odds (HO) 1.95 divided by Away Odds (AO) 3.84 = 0.5078
Using the 2019/20 Cluster Table for Italy, the over and under probabilities for Sassuolo home matches and for Udinese away matches were found using the appropriate HO/AO cluster containing the value of 0.5078.
These percentages were then copied into an extra ‘helper’ spreadsheet (i.e. the two top lines of the tables on the left).
Using the two probability percentages collected from both teams, the average was calculated (Over 0.5 bets example):
161.8% divided by 2 = 80.9%
This percentage was then converted into the expected Zero odds:
This process was then repeated for all Over/Under bets.
The third line of our helper spreadsheet is for manual entering of the market odds being offered for these bets.
As we were limiting ourselves during the experiment to bets within the 60% to 80% cluster, there was no difficulty choosing the bets for this particular match as there was only one visible within this probability cluster. The bet ‘Under 2.5 goals’ with a probability to win of 68.2% (corresponding Zero odds: 1.47) was being offered at outstandingly good odds of 3.10.
By the way, this bet won as the match ended in a 0:1 result. Of course, there was an element of ‘luck’ involved as on paper it also had a 31.8% probability of losing. Also, the expected ‘Profitability’ as well as the expected ‘Yield’ were artificially high, which would normally have led us to dismiss this bet as viable.
I will summarise these two very important considerations next in the article but if you wish to understand the concepts of profitability and yield in more detail, buying and working through the coursebook is your only option. It simply is too vast a subject to summarise in an article and is not the sort of information I wish to give away for free 🙂
Further Reading:
How to Use Soccerwidow’s Over/Under Betting Cluster Tables
5 Simple Steps to Win Over and Under Betting
Profitability (Value I)
Profitability is the relation of profit/loss to the money spent. In other words, profitability is an index for measuring financial success (operational profit) in relation to the costs (money spent) of running the venture.
When applied to gambling, profitability measures betting proficiency in relation to its expenses.
Profitability Formula:
If you wish to learn a little more about what profitability in betting means, here’s an article with the definitions and some example calculations: Stake, Yield, Return on Investment (ROI), Profitability – Definitions and Formulas
The nice thing is that it is actually possible to predict the expected profitability if you have calculated the Zero odds and know the market odds of the bet you are thinking of placing.
![]()
You can see the results of these calculations in Table 3 (Sassuolo vs. Udinese calculations) in the row below the market odds. Try to come up with these numbers yourself! 🙂
Of course, all these calculations are about probabilities and a future outcome; they aren’t set in stone and results always come with a deviation. I cannot dive deeper into the matter of deviation at this stage but once again recommend the coursebook, where you will find almost a third devoted to explaining this quite difficult topic in step-by-step detail.
However, what we will look at here is the graph of the distribution of Profit and Losses from our Over/Under experiment by expected Profitability.
For those of you who didn’t follow the experiment as it progressed… During July 2020 we published almost daily Over/Under picks with probabilities between 60% and 80%.
Often, there would be only one bet apparent in this cluster (like in the example Sassuolo vs. Udinese) and we would choose this bet without taking any ‘value’ into consideration or worrying about the expected ‘Profitability’ or expected ‘Yield’.
Indeed, the profitability and yield might have carried negative values, but the picks would still be included in our portfolio and published.
The reason for this is that when you calculate Zero odds and consider the deviation, the market odds may be higher or lower but still be ‘fair’.
It seems like a paradox but having negative ‘value’ attached to a bet calculation doesn’t mean that it is a bet without ‘value’.
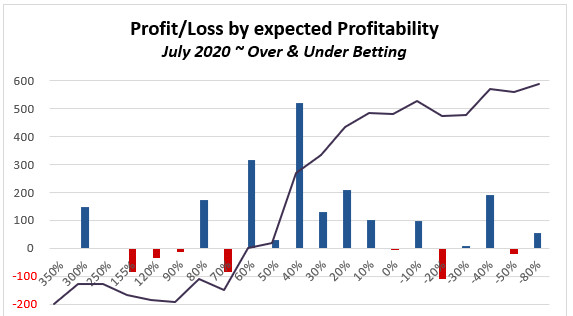 Table 4: July 2020 – Over Under experiment P/L results graph by expected Profitability
You can see from the graph above that at its beginning the P/L curve wanders around the -200 mark and then starts rising. The starting point for the rise is around 95% and it stops at -40%. This can be used as a knock-out criteria when selecting bets to place:
Advice for those of you who are actively using the Cluster Tables for investment purposes…
If you wish to play a similar system to the picks showcased in our experiment, then please choose your bets by sticking religiously to the 60% to 80% probability cluster and use the expected Profitability as a knock-out criterion.
If you have only one bet in this probability cluster, and it carries an artificially high profitability value like the one shown in this article (Sassuolo vs. Udinese U2.5 goals), then you need to make the tough decision whether or not to play the bet or leave it alone.
Yield (Value II)
Yield is the Profit/Loss ratio applied to the total capital employed (total staked). When applied to gambling, Yield measures betting effectiveness compared to total turnover. (The interest received from securities, i.e. stakes)
Yield Formula:
In football betting, any yield over 7% is considered to be a very good result. Be careful when you hear people talk about their betting strategies or offering betting systems for sale with a high yield. This is intended to impress the reader, but a high yield is always an indication of high-risk strategies employed!
Like with the expected profitability in the section above, it is also possible to calculate the expected yield simply by having calculated the Zero odds and knowing the market odds.
![]()
Please have another look at Table 3 (Sassuolo vs. Udinese calculations) in the row below the Profitability. Again, see if you can match these figures with your own formulas or calculations.
Once again, high yield systems mean high risk. Usually, you will need to play many bets to move forwards with systems of this nature. The reason is simple: High risk means low probability and that means a very irregular distribution of winning bets – and lots of losers along the way!
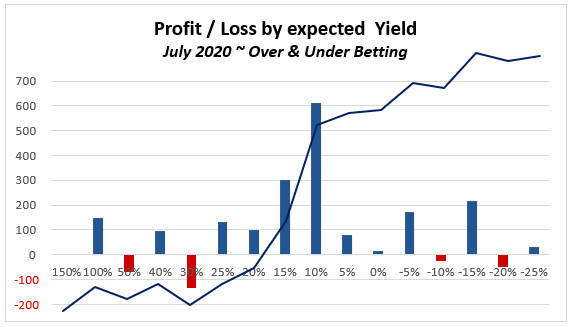
You can see this for yourself in the graph below, which represents the experiment’s distribution of Profit and Losses by expected Yield:
 Table 5: July 2020 – Over Under experiment P/L results graph by expected Yield
You’ll see from the curve that expected Yield over 30% didn’t produce any profits and neither did an expected Yield below -15%. That there even was a negative expected Yield is because of deviation.
This factor can be used as a second knock-out criteria when choosing bets:
Advice for those who actively use our Cluster Tables…
Don’t take our guidance here as gospel. Of course, you can choose whichever probability clusters suit your personal acceptance of risk. You don’t need to stick religiously to the 60% to 80% range that we used in this public experiment.
But, ideally, what you then need to do is to select only matches in your chosen clusters (you can do this retrospectively) and analyse their performance by expected Profitability as well as expected Yield. In doing this, you should then be able to build your own knock-out criteria and adjust accordingly.
I really hope you enjoyed this article and learnt something along the way. Please don’t hesitate to ask any questions in the comment section below.
Lastly, keep faith in statistics! Despite the pandemic, every league will continue playing on a professional level and hence, past statistics can be applied to predict future performance. How else do you think bookmakers set their odds?
Note:
And if you need further incentive to investigate our Cluster Tables further, don’t forget that the 169-page Odds Calculation coursebook comes with a free German Bundesliga Cluster Table. Buy the coursebook, snap up a bargain in the process, and begin betting on the over/under markets straightaway!




Dear Soccerwidow,
The ranges for expected profitability and Yield, can be used also for other betting markets, like AH or 1X2 ? or they are exclusively for O/U ?
Kind Regards
Hi Socrates, the report and the findings are for the Over/Under goals market and not for 1×2 or ASH.
I have purchased the course book and intend to purchase some more cluster tables to take advantage of your very generous Black Friday offer. Have you ever thought of producing Tables for Bundesliga 2, The English Championship and the Segunda in Spain. These are all leagues which I follow and enjoy more than the French 2 which you do offer. Many thanks.
Hi Peter,
the Bundesliga 2, English Championship and the Segunda in Spain change too often their teams so that there aren’t many teams in them with 5 consecutive years of statistics that are required for the Cluster Tables to work. Anyway, you will find plenty of betting opportunities in the other leagues.
I wish you all the best with your betting!
Soccerwidow
I would be interested to see a 0-0 backing experiment just to see what happens.
Hi Andrew, you just gave me an idea with your question… I will prepare the monitoring spreadsheet for download as it contains the calculations for all 77 matches. Then everyone who wishes to run an experiment can do this on paper.
I’ll email you this spreadsheet for free as soon as it’s ready.