
Cluster Table Screenshot - Betting Table Tab
Soccerwidow’s Cluster Tables are an essential tool for identifying value bets and creating a profitable portfolio in the Over/Under ‘X’ Goals market.
They rely on dividing historical data (previous five complete seasons) into clusters according to the “HO/AO quotient” to provide a reliable comparison with future matches under analysis.
Betting odds are a mixture of statistical fact and public opinion (people voting with their money) as to what the likely outcome of an event will be.
Introducing the HO/AO quotient allows us to to ‘cluster’ groups of past matches and with that, to quantify the mutual relationship between the number of goals scored in matches and the strength of the teams involved. (The HO/AO quotients are a practical application of corellation).
This allows us to put an upcoming game into perspective.
In other words, we use the group of past matches bearing HO/AO quotients most similar to the match under analysis in order to make more accurate assessments about its likely number of goals.
The number of goals scored↔team strength relationship is a hugely strong correlation known to the bookmakers and used to a greater or lesser degree when setting their opening odds.
However, as public opinion (market pressure) leads to ‘errors’ in market pricing (odds), using the knowledge of the correlation allows us to spot ‘value’.
Following on from our Betting with Cluster Tables introductory article, here are the four simple steps needed to calculate pinpoint zero odds for intelligent value betting decisions in the Over/Under ‘X’ Goals market:
- Find the Home and Away Odds
- Calculate the HO/AO Quotient
- Record the Cluster Table Results
- Perform the Final Calculations
We shall look at each of these steps using the English Premier League as example.
Let’s look in fine detail at the EPL match: West Ham vs. Southampton from 31st March, 2018.
Step 1 – Find the Home and Away Odds
One of the most important components of the Cluster Tables is the HO/AO quotient (home odds divided by away odds), hence the need for both odds before referring to the tables.
To find the latest, up-to-date odds for any fixture you can employ bookmakers or betting exchanges of your choice, or make use of an odds comparison site. For the sake of our example, we are using OddsPortal.com as they are the only site showing time-stamped odds to support our illustrations.
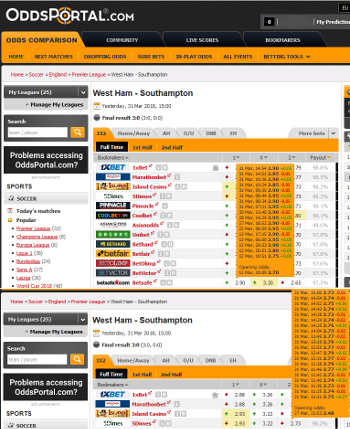
The screenshot on the left is a composite image showing both the home and away odds just before this game started. Click on the image to enlarge it in a new tab.
Betsafe offered a price of 2.90 on West Ham six minutes before kick-off, whilst 5Dimes gave best price of 2.73 on Southampton seconds before the start.
Despite the multitude of odds movements throughout the entire ante post market, you will find in the vast majority of cases that the relationship between the home and away odds will stay pretty much the same throughout the ante post market.
Usually, the HO/AO quotient locates the match firmly between the two ends of a cluster, and the quotient tends to remain in that same cluster group no matter how the odds move during the lead up to kick-off.
This means that the timing of the analysis is not critical; you can perform it at any period during the ante post market before the match kicks-off. And of course, bet placement timing then also becomes just a matter of finding market odds containing value.
Timing only becomes an issue in the very rare event that the HO/AO quotient places the match very close to one of the ends of the cluster range for either team. It is then always wise to check odds close to kick-off to ensure that you have the match in the right HO/AO clusters for both teams.
Most of our tables are based on Pinnacle bookmaker odds, and for these leagues, you need only find which odds Pinnacle is offering at that time.
A small number of our tables use the highest audited bookmaker odds from a select panel included at Oddsportal. For these leagues, you will need to find the highest home and away odds being offered from a small range of bookmakers at the time.
Okay, we have our home and away odds – onto the next step…
Step 2 – Calculate the HO/AO Quotient
Easy! Take a calculator or enter the figures into a spreadsheet and just divide the home odds by the away odds to provide a quotient.
In this case, the quotient is: 2.90 divided by 2.73 = 1.0623 (rounded-up)
Step 3 – Identify the Relevant Cluster and Percentage Result
Cross-checking any team’s HO/AO quotient against their statistical percentages for any of the over/under 0.5 to 6.5 options in any match under analysis is extremely easy.
Within the Cluster Table for the appropriate league, click on the Betting Tables tab. This reveals a one-touch spreadsheet for obtaining both team’s results.
Here is the table of figures for West Ham (click on the image below to enlarge it in a new tab – and then use the magnifier to enlarge again if necessary):
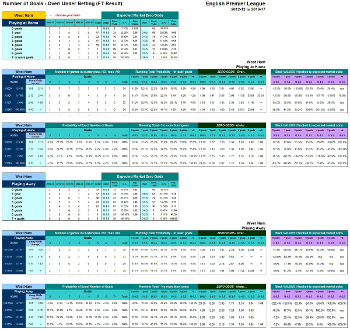
To change the team, simply click on the orange team name in the top left-hand corner to access the drop-down menu of all teams with five-season data sets.
By clicking on the team you are looking for, the figures in the table will automatically revert to those of that team.
The first half of the sheet contains the home figures: Summary at the top, Over ‘X’ Goals, and then Under ‘X’ Goals. The bottom three panels are the away results.
For this example, let’s decide to go for the most popular ‘Over 2.5 Goals’ bet.
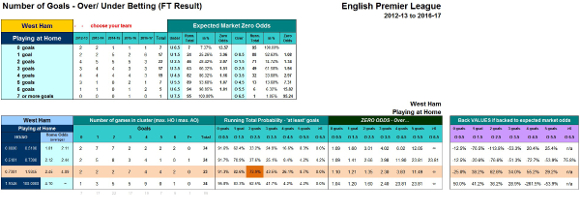
For West Ham’s home figures, using the second panel from the top, you can see on the left-hand side in dark blue, their dedicated HO/AO clusters.
The HO/AO quotient we have calculated is 1.0623 and this fits neatly into the third cluster down. Looking under ‘Running Total Probability’, we simply record the percentage figure, in this case, 73.9%.
Here are West Ham’s top two panels with the relevant cluster row and percentage result for Over 2.5 Goals highlighted:
And after changing the team name, here are Southampton’s away figures in their fourth and fifth panels:

You will also note that the HO/AO quotient fitted very firmly inside the relevant cluster group of both teams, and not too close to its edges (West Ham’s cluster group was 0.7301-1.9345, whilst Southampton’s was 0.8211-1.3880).
Again, you will rarely encounter situations that will need monitoring – most games will see the same cluster groups used despite the odds movements throughout the ante post market. This means that neither analysing nor placing the bets is time-sensitive, and both exercises need not be performed at the same time either.
Next Page: Step 4 – Do the Maths!




Hi
Running a mac. The spreadsheets do not import all the formulas and links on Numbers.
I am guessing I am not the first to ask this question – Any easy solutions?
Thanks
Chris M
Hi Chris, you are the first to ask. 🙂
Unfortunately, we don’t work with a mac but here’s what the Apple support centre says:
Import an Excel file:
Hope that helps.
Best wishes,
Soccerwidow
Hi
Thanks for the reply.
Quick solution – I bought office for mac.
Loved the course – didn’t realise how much I didn’t know! lol
Thanks and keep up the good work
Chris M