Comparison of the Relative Deviation Graphs
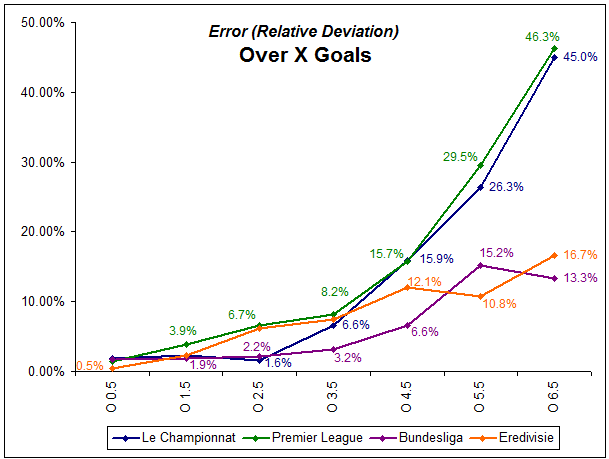
Here’s a combined graph showing the comparison of relative deviations (errors) for the Over ‘X’ goals market, for all four leagues:

Over ‘X’ Goals Interpretation:
- French Ligue 1 and German Bundesliga 1 show the smallest deviation on over 2.5 goals; it might be worth developing a system to bet on over 2.5 goals in both these leagues. However, from the perspectives of the EPL and the Dutch Eredivisie, betting on over 2.5 goals should be avoided because the results show an average variance of around 6.7% per year. This means the results are statistically unreliable and fluctuate/vary up to four times more than the French and German counterparts.
- German Bundesliga 1 gives the most consistent impression and except for the ‘over 5.5 goals’ threshold (where the Dutch show the smallest deviation), the Germans have their noses in front in all the other over ‘X’ goals betting categories making this an ideal league for consistently accurate over ‘X’ goals forecasts.
- Exactly the opposite occurs in the EPL (which has the highest deviations) and avid followers will also agree that results in this league are never easily predictable, with regular surprises and ‘upsets’.
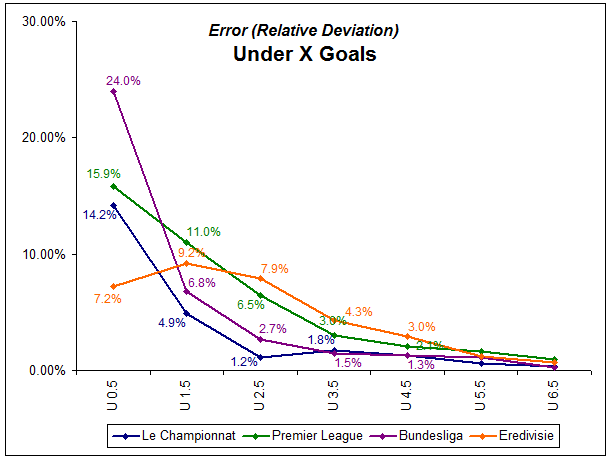
…And to complete the story, here’s a combined graph showing the comparison of relative deviations (errors) for the Under ‘X’ goals market, for all four leagues:

Under ‘X’ Goals Interpretation:
- Under 0.5 goals (i.e. 0-0 results) shows the Dutch league with the lowest deviation and therefore producing the most regular and reliable results.
- In the under 2.5 goals market the French have significantly less deviation than any of the other three leagues. We have already seen they are worth a punt on the over 2.5 goals market, so concentrating your analytical resources on over/under 2.5 goals in Ligue 1 is the way to go, but again, avoid the Dutch and the English.
- For more “reliable” bets (i.e. higher probability, but obviously lower odds offered) you should consider looking at the under 3.5 and/or under 4.5 goals categories and, no surprise, just stick to the French or German top-flight leagues.
Produce your own Relative Deviation Graphs
You can easily produce graphs like the ones presented above in whichever league you wish to analyse.
Simply add-up all the zero goal matches plus the games with only one goal to produce the ‘under 1.5 goals’ result for a season; zero goals, plus one goal, plus two goals produces ‘under 2.5 goals’, and so on.
Then, calculate the average of each respective over and under event category by dividing the sum in each category by the number of seasons you have analysed.
After this, compare the observed results of each year with the average and compute the relative deviations (see also my article Calculation of Odds: Probability and Deviation).
The final step is to build the average of the relative deviations (errors) for each year and you’ll come up (hopefully) with something similar to the above graphs.
Application of the Findings to Betting
Betting on the German Bundesliga 1 and/or French Ligue 1 on over 1.5 goals (or even over 2.5 goals) as well as under 3.5 goals (and/or under 4.5 goals) seems to be statistically rather a ‘sure thing’, so long as you are planning a strategy around securing long-term profits using a proper staking plan.
You will also need a mathematical advantage or ‘edge’, which means never betting under ‘value’. The latter part of the equation is probably the biggest challenge!
Betting ‘under’ value will lose in the long run as described in the article Calculation of Odds: Probability and Deviation.
Learn Value Betting
If you need to learn how to evaluate and process raw data, calculate odds, probabilities and recognise VALUE, please look no further than Socccerwidow’s Fundamentals of Sports Betting course.
More on Goal Distribution (external links):
Goal Production In Six Leagues, Or: Are the Eredivisie and Ligue 1 Different?
Goals Per Game Ratios
As ever, thanks for reading and best of luck with all your football betting!


Thank you for sharing this article. So in an attempt to be more practical. Assuming we detected that under 1,5 goals has an average of 9% success with a deviation of +-1,5%. That would mean the range should vary from 7,5% to 10,5%. How could we build our portfolio? Take the worse scenario of 7,5% which means we need a minimum odds of 1/0,075 equals 13,33. But who can guarantee that we will get these odds from the bookies?
Hi betakos, there is no “guarantee” that you will get your desired odds from the bookies. If you use exchanges such as Smarkets then, of course, you can “ask” for your desired odds and hope that somebody matches your bet.
Do you know my course Fundamentals of Sports Betting – Over/Under X Goals? In part 2 I explain in great length how to utilise the knowledge of odds calculation, and with the cluster tables which come with the course I provide readers with a powerful portfolio betting tool for value betting.