
We recently received a very valid question from a reader who went through our 2017-18 Winter League Report with a fine-tooth comb:
“I have a question for you since your strategy in the German Bundesliga was Underdog Whole Season, why do you show only Home Underdog bets in the system’s performance?”
So, why?
The answer is very simple: Because the HDAFU Tables identify Value Bet clusters. Although an HDAFU Table may be perceived as a ‘System Betting’ tool the most profitable historical betting clusters are the ones packed with Value Bets. And in the German Bundesliga, in the last five seasons (and beyond) these have mostly been home underdog bets.
It doesn’t matter which angle you approach betting from, to make a stable profit you must always ensure ‘value’ is on your side.
You may now ask Why do certain clusters of the HDAFU Tables contain Value Bets?
To shed light on this you really need to understand…
How do Bookmakers Set their Odds?
The bookmaker trade is a business aimed at making profits like any other business. Although they claim that their odds are ‘fair’ this doesn’t implicitly mean that their odds represent the ‘true’ probabilities of each event occurring.
Something classed as being ‘fair’ means only that it is carried out without wishing to cheat or to achieve an unjust advantage. However, it is neither ‘cheating’ nor ‘unjust advantage’ to optimise profits, is it? Otherwise, you could blame every profit-making company for setting ‘unfair’ prices only because they calculate with high-profit margins.
Take the example of a popular team like Bayern Munich. Playing at home, they win approximately 85% of their matches give or take every season. The ‘true’ average odds should, therefore, be in the region of 1.18 (1/85%). However, with the weight of money (the majority of bets being placed on the most probable winner), the bookmakers can reduce the odds on Bayern to win, say, to 1.15, increasing their profits in the long run, but still offering ‘fair’ odds on a match to match basis.
Of course, this also applies to Bayern’s away games. When playing away, Bayern wins approximately 65% of their matches, which in odds is 1.53 (1/65%). However, the average odds offered by the bookmakers for Bayern to win away are 1.44. That’s a clear and significant reduction. Are you with me?
Now, let’s dive a little bit deeper into odds calculation to help you understand what makes the HDAFU Tables so very special…
Changing One Side Affects the Other Side
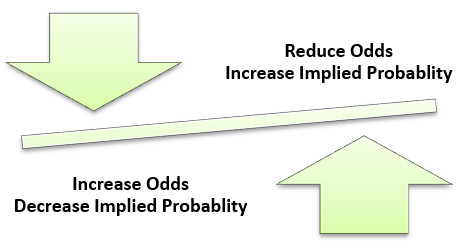
To show you the above illustration in numbers we will look in more detail at one of the Bundesliga matches in our 2017-18 Winter League Report.
On the 9th September 2017 Bayern played away against Hoffenheim. Bayern’s ‘true’ chances to win that game were 47.78% (see Value Calculator results below):
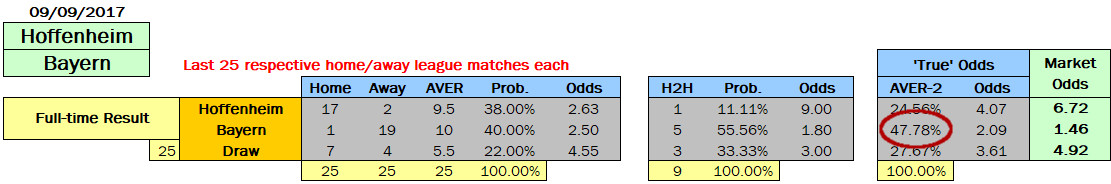
The ‘true’ odds corresponding to a 47.78% probability are 2.09 (1/47.78%).
The problem bookmakers probably had with this particular game, especially if they would have offered odds in the region of 2.09, 2.0 or even 1.9 for Bayern to win, is that there wouldn’t have been enough bets on either of the two other possible results, the home win and draw: The book would be unbalanced with the bookmaker facing a huge potential liability if Bayern were to win.
Football followers with a low understanding of probabilities know that Bayern, even playing away, will probably win the match. Regular punters would be expecting odds in the region of 1.5 or 1.6.
Odds around 2.09 would have encouraged far more money on Bayern as punters would have perceived the odds as an opportunity to cash-in on ‘higher than normal’ odds for a Bayern away win.
Therefore, to avoid too many bets on this outcome the bookmakers were literally forced to reduce Bayern’s odds to match public expectations.
So, instead of pricing the odds close to their ‘true’ probability of 47.78% (in odds: 2.09), the bookmakers had to offer the away win close to the ‘expected’ probability (65%). Hence, they offered odds for Bayern to win of 1.46 – an implied probability of 68.5% (1/1.46).
Of course, Bayern’s statistical chances didn’t suddenly increase by 20% to win that match, although the odds offered may have swayed people into believing this.
Probabilities: Home Win + Draw + Away Win = 100%
Statistically speaking, the sum of the probabilities for any match outcome is always 100%; it is either a home win, a draw or an away win.
Therefore, if the odds (applied probabilities) for an away win are changed due to market pressure, it naturally affects the draw and home odds (implied probabilities).
In this example:
- The ‘true’ probability for Hoffenheim to win of 24.5% (in odds: 4.07) was reduced to 14.9% (odds increased to 6.72)
- The ‘true’ probability for the draw of 27.7% (in odds: 3.61) was reduced to 20.3% (odds increased to 4.92)
- The ‘true’ probability for Bayern to win was increased from 47.8% (odds of 2.09) to 68.5% (odds reduced to 1.46)
The ‘fair’ probabilities add up to 103.7%: 14.9% plus 20.3% plus 68.5%
The 3.7% difference is called the bookmakers’ overround, but that’s another topic. However, what you should have learned by now is that if the probability (odds) of one side is massively changed the probabilities (odds) of the other two outcomes must consequently be affected.
In this example, the ‘underdog’ at home (Hoffenheim) became even more of an ‘outsider’ and hence a Value Bet (the price offered was much higher than that of its statistical probability).
Just as a side note, Hoffenheim won the game 2-0
The HDAFU Tables Help You to Discover Value Bet Clusters
As shown in the example above there was a clear gap between public expectations and the ‘true’ probabilities, which literally forced the bookmakers to adjust their odds for Bayern, who were shown as a much stronger away favourite than they actually were.
In the EPL the same can be said of the Draw expectation; in Italy, it’s the Away Win and so on. For specifics, you will have to dive deeper into the analysis of the 2017-18 Winter League Report, where the patterns in the leagues chosen for that season are revealed.
Each league has its own betting patterns and punter preferences and the bookmakers react accordingly.
What makes the HDAFU Tables so special is that they highlight where the odds or HO/AO (home odds divided by away odds) clusters are profitable for the bettor if bets are placed constantly and consistently within the parameters of these clusters. The majority of bets made within these clusters are Value Bets.
So, just remember: There is a public expectation of match outcomes and the bookmakers react by reducing or increasing odds and balancing these changes by changing the odds for the other two outcomes. It’s as simple as that.
Time Saving ~ Risk Diversification ~ Value Betting
Value Bettors who calculate each game individually will find it very challenging to identify enough bets for each weekend to diversify risk sufficiently enough. Every match requires time to be analysed.
The calculations for just one match and checking its bets for viability could take as long as two to three hours. If you’re adept at using our Value Calculator, one match might take you 15-20 minutes to analyse. Even then if it takes only 25 minutes per match in total to identify, choose and place a single bet, if you want a Saturday portfolio of at least 15 matches for diversification, it’s going to take you more than six hours to achieve – every Saturday.
With the HDAFU Tables life is much easier. You don’t need to carry out any individual calculations once you have identified the profitable clusters and checked them carefully before you start placing real bets – and you only need to decide upon your systems once (whole season systems) or twice (half-season systems) per season. Once you have prepared a large enough and diversified portfolio of systems from different leagues, you can let the statistics do the work for you.
Of course, an additional finishing touch for those of us with time when compiling the weekly portfolio of bets is to cross-check those highlighted by the HDAFU Tables (portfolio builder) against the Value Calculator (individual match investigator) and ensure that the majority are actual Value Bets on the day.
One thing you can take for granted is if a cluster has been packed with Value Bets during the previous five seasons it’s likely that the same cluster will continue to churn out Value Bets in the following season.
Many thanks, João, for your question and I hope this article helps clarify things for a wider audience!


